Fig. 7.
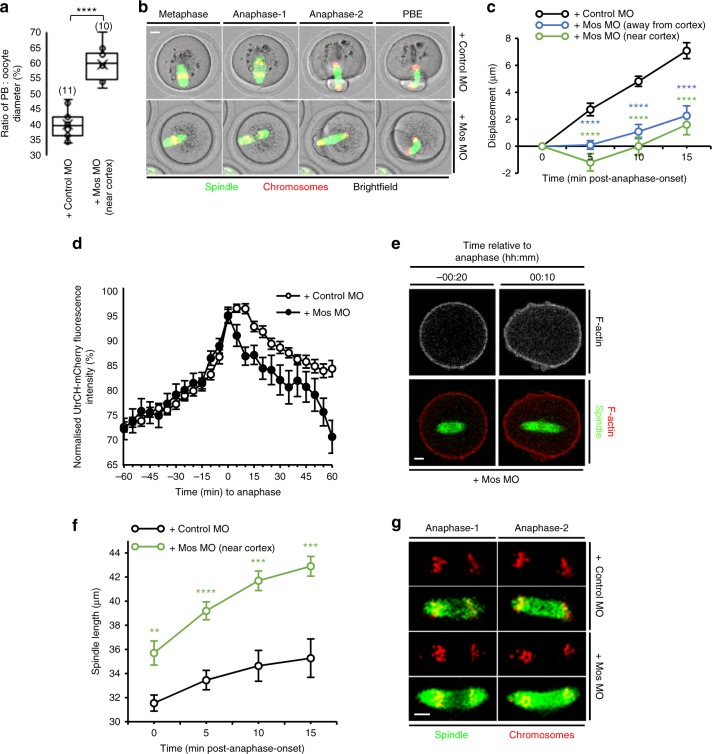
Mos depletion impacts anaphase-spindle migration and spindle length. a Ratio of PB:oocyte diameter for mock-depleted oocytes and Mos-depleted oocytes having cortical-proximal spindles at the time of anaphase-onset. Oocyte numbers are shown in parentheses from a minimum of three independent experiments. b Large PB produced following Mos depletion despite the spindle being adjacent to the cortex at anaphase-onset (see Supplementary Movie 29). c Quantification of spindle displacement (due to the marked anaphase spindle elongation [see d], midzone displacement rather than posterior pole displacement was quantified) between anaphase-onset and anaphase-completion for Mos- and mock-depleted oocytes (n = 11). For Mos-depleted oocytes, results were grouped based on whether spindles underwent anaphase close to the oocyte centre (MosMO (away from cortex), n = 12) or close to the cortex (MosMO (near cortex), n = 10). d Cytoplasmic UtrCH-mCherry fluorescence in relation to anaphase-onset for mock- and Mos-depleted oocytes (n = 20 and n = 17, respectively). e Live Mos-depleted oocyte in which spindle undergoes anaphase close to the oocyte centre associated with increased cytoplasmic F-actin. f, g Changes in spindle lengths between anaphase-onset and anaphase-completion for live mock- and Mos-depleted oocytes (n = 11 and n = 10, respectively). Times in panels are hours:minutes relative to anaphase-onset. Scale bars, 10 µm. Two-tailed Student’s t test (a, f) or one-way ANOVA (c) used for statistical analysis. P values represented as **P < 0.01, ***P < 0.001 and ****P < 0.0001

