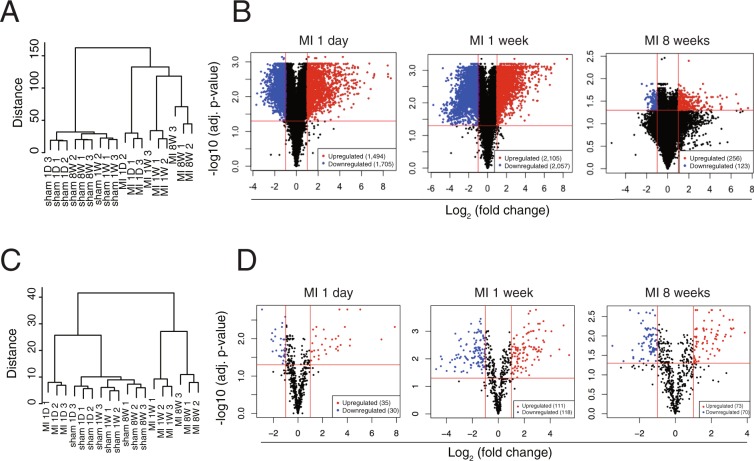
Figure 1.
Differentially expressed genes in mouse model of MI derived by RNA-seq. (A) An unsupervised cluster analysis of the mRNA-seq data of MI and sham at 3 different stages. (B) Volcano plot showing DEGs in 1 day, 1 week, and 8 weeks post-MI. (C) An unsupervised cluster analysis of the miR-seq data of MI. (D) Volcano plot showing DEmiRs in MI. Red dots indicate significantly upregulated miRNAs and blue dots indicate downregulated miRNAs.

