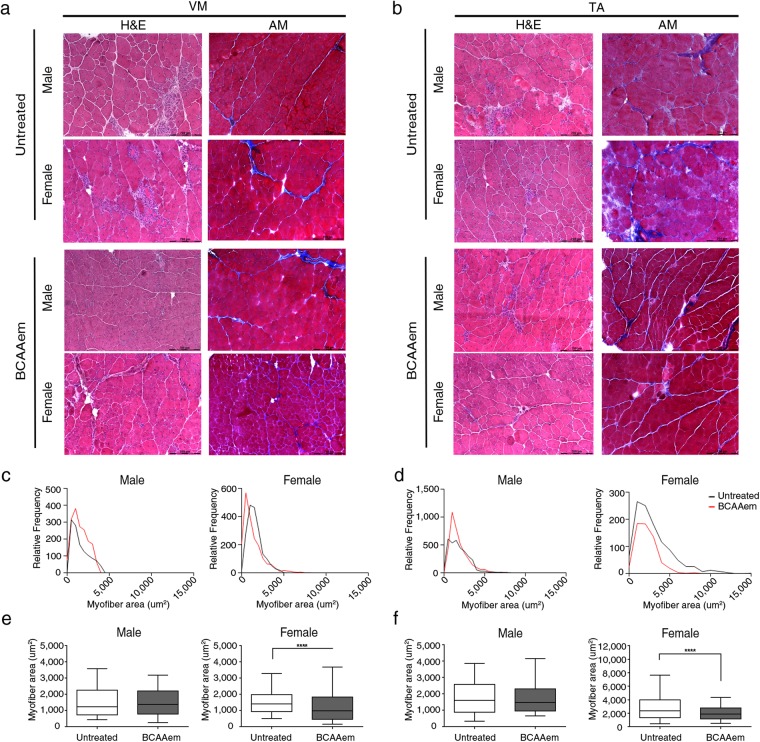
Figure 1.
Haematoxylin and eosin (H&E) and Azan-Mallory (AM) analysis of BCAAem-treated and untreated mdx male and female mice. Representative H&E and AM staining of vastus medialis (VM) (a) and tibialis anterior (TA) (b) of untreated and BCAAem-treated mdx male and female mice. Scale bars, 200 μm. Quantification of the relative frequency of the myofibre cross-sectional area (CSA) expressed as the frequency distribution of the VM (c,e) and TA (d,f) muscles of the untreated and treated experimental groups of male and female mice. Boxes indicate 25th to 75th percentiles; whiskers indicate 5th to 95th percentiles and the line indicates the median (n = 5 per group). Statistical error analysis was performed by two-way ANOVA with Bonferroni correction; ****p < 0.0001 for the indicated comparisons.

