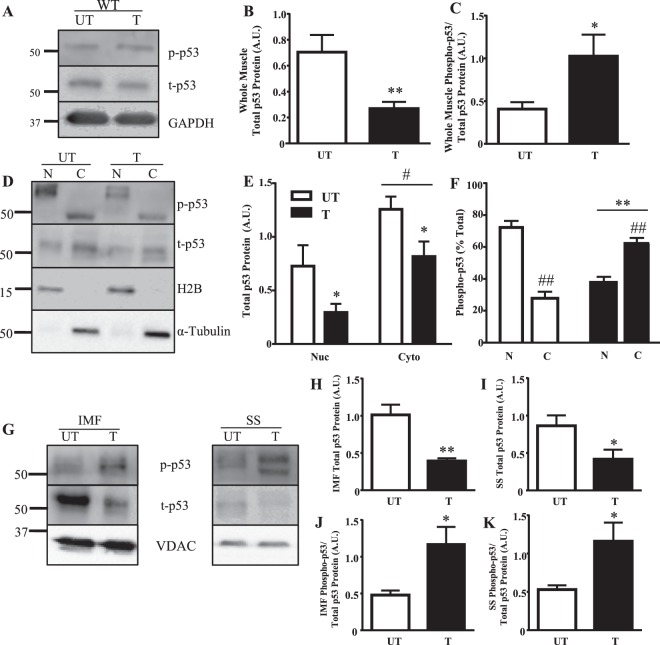
Figure 1.
p53 subcellular localization with training. (A) Whole muscle (B) total p53 protein and (C) phosphorylated p53-Ser15 protein was measured in WT mice. GAPDH was utilized as the loading control for all immunoblotting in whole muscle (n = 6–7/group); *p ≤ 0.05, **p ≤ 0.01, UT vs. T, Student’s t-test. (D) p53 protein was measured in nuclear and cytosolic fractions in WT mice. H2B was used as a nuclear loading control and α-tubulin was used as a cytosolic loading control. Basally and with training, nuclear and cytosolic (E) total p53 protein, and (F) percent total of phosphorylated p53-Ser15 protein was measured (n = 4–5/group); *p ≤ 0.05, **p ≤ 0.01, UT vs. T; #p ≤ 0.05, ##p < 0.01, Nuclear vs. Cytosolic (n = 4–5/group), Student’s t-test and 2-way ANOVA. A main effect of training was observed. (G) Mitochondrial p53 protein was examined in SS and IMF mitochondrial subfractions. VDAC was utilized as a mitochondrial loading control. Total p53 protein in (H) IMF, and (I) SS mitochondria was measured (n = 4–5/group); *p ≤ 0.05, **p ≤ 0.01, UT vs. T, Student’s t-test. Activated p53, corrected for total, was additionally measured in (J) IMF, and (K) SS mitochondria (n = 4–5/group); *p ≤ 0.05, UT vs. T, Student’s t-test. Data are presented as mean ± SEM.

