Figure 1.
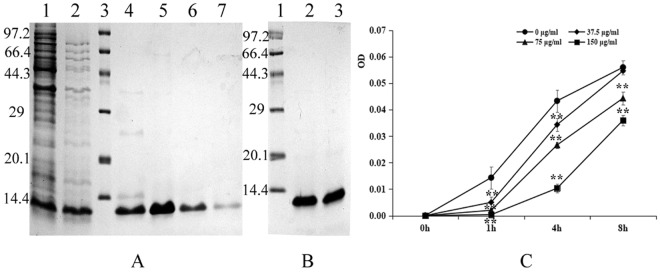
Analysis of expressed fusion and purified pBD2 and its antimicrobial activity. (A) Analysis of expressed fusion pBD2. Lane 1 indicates the induced protein; Lane 2 indicates the protein after boiling at 80 °C for 10 min; Lane 3 indicates the protein marker; Lanes 4–7 indicate the 4–7 fractions after purification of pBD2 by HisTrapTMHP chromatography; (B) Analysis of the purified protein. Lane 1 indicates the protein marker; Lanes 2–3 indicate the purified fusion protein after enrichment; (C) Antimicrobial activities of pBD2 against approximately 109 cfu/mL E. coli at different time points. OD values at 630 nm (reference 405 nm) were measured at different times at various pBD2 concentrations. The OD value at 0 h was adjusted to 0, and the increased OD values were calculated. The full-length gels are presented in Supplementary Figure 1.

