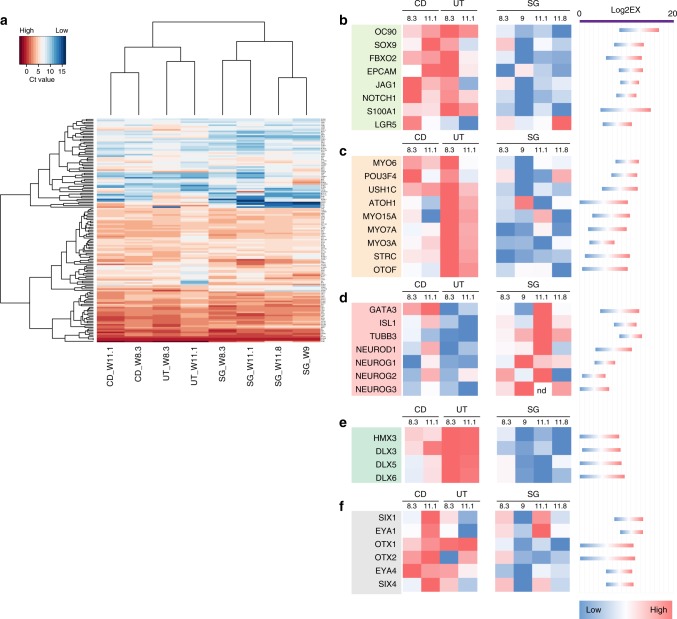
Fig. 3.
Gene expression analysis of the microdissected cochlear duct, utricle, and spiral ganglion. a Ct values obtained with multiplex qRT–PCR were used for hierarchical clustering. Strongly expressed genes with mean normalized Ct values below 10 are shown. Levels of expression are indicated by the color code. b–f Relative expression level of each gene among the three different tissues across multiple samples. The color code shown is a red-to-blue gradient binned into eight discrete values, with dark red indicating the highest expression level among the samples and blue the lowest. The range of expression values for each gene represented by the color range is shown on the right for each gene as Log2EX value (limit of detection) -the raw Ct value. b Epithelial and supporting cell markers; c hair cell markers; d neuronal genes; e vestibular organ development; f early otic development. Samples used for these experiments were E1204, E1208, E1235 and E1236

