Fig. 6.
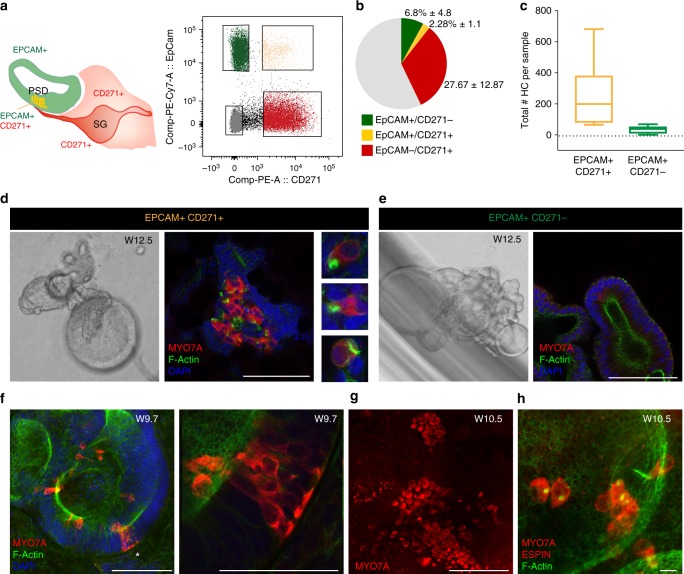
EPCAM+/CD271+ cells are hair cell progenitors. a Schematic illustration of EPCAM and CD271 expression in the cochlear duct. Double-positive cells in the PSD are shown in yellow. FACS plot showing the gated populations from a W12 sample (E1242). b Pie chart illustrating the distribution of the four FACS-sorted populations. n = 8 fetal tissues (week 9.4 to 12.3). Values are mean percent ± s.d. c Quantification of the total number of hair cells-like cell (HC) per sample obtained from the two sorted populations (N = 5 samples: W9.7 (E1238), W10.5 (E1270), W12.5 (E1242), W11 (E1254), and W12 (E1289)). EPCAM+/CD271+ cells: N = 19 organoids; EPCAM+/CD271− cells: n = 47 organoids.. Box plot indicates distribution, middle line: median, whiskers: minimum and maximum. d Representative examples of organoids derived from EPCAM+/CD271+ and e EPCAM+/CD271− populations (W12 sample, E1242). Immunostaining for MYO7A and co-staining with phalloidin and DAPI is shown. Selected hair cells-like cell morphologies from the 3D stack are shown in d. Scale bars = 100 μm. f Organoid derived from EPCAM+/CD271+ cells from a W9.7 sample (E1238) stained for MYO7A, F-actin and DAPI. Scale bar 100 μm. The area marked by the asterisk is enlarged in the right panel. g Organoid derived from EPCAM+/CD271+ cells from a W10.5 sample (E1270) immunostained for MYO7A. Scale bar = 100 μm. The same organoid is shown at higher magnification in h. h The sample is re-stained for ESPIN (red) and F-actin. Scale bar 10 μm

