Fig. 1.
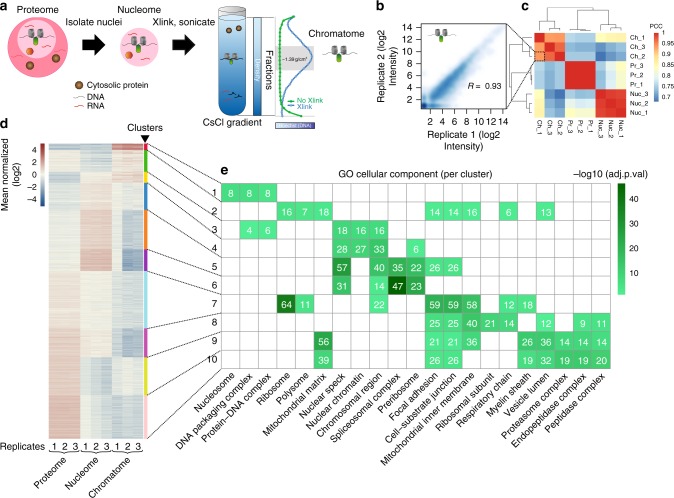
Strategy to quantify chromatin-associated proteins in different cellular states. a Experimental strategy for chromatin and nuclear enrichment. The blue and green lines to the right of the gradient represent Hoechst staining (x-axis) of different gradient fractions (y-axis). Xlink refers to cross-linking with formaldehyde. b Reproducibility between replicates of independent chromatome preparations. c Reproducibility among normalized Chromatome (Ch), Nucleome (Nuc), and cellular Proteome (Pr) signal. Scale is similarity as Pearson’s R. PCC Pearson’s correlation coefficient. d Clustering of signal at the protein level across subcellular fractions and all replicates. Scale is mean-normalized log2 converted reporter intensities. Colored annotation bar represents individual clusters. e Top two cellular component ontologies for each cluster and their representation in all clusters. Terms enriched in each cluster are noted on the x-axis, clusters on the y-axis. Number of proteins belonging to a category in a particular cluster are noted in white text for the corresponding cell. Significance is −log10 (adjusted p-value). White squares represent nonsignificant groups

