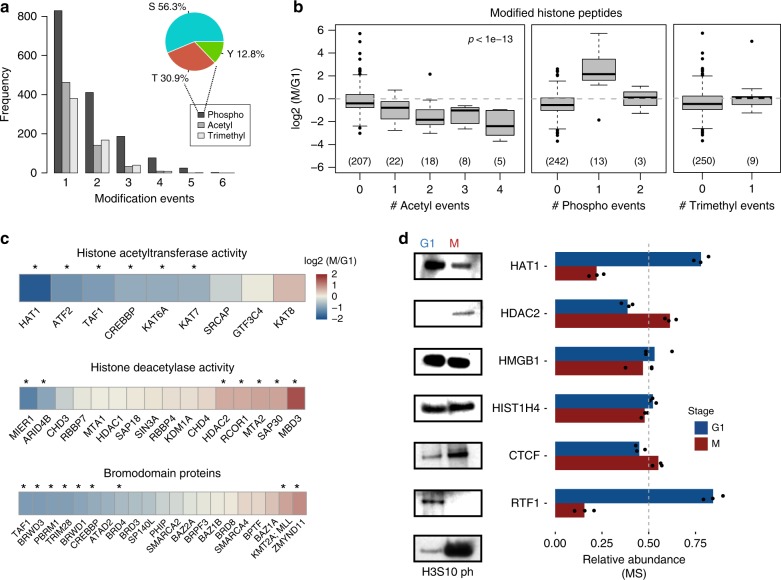
Fig. 3.
Differential abundance of post-translational modifications at the G1/M transition. a Frequency of peptides detected and quantified with given modifications. Pie-chart inset: percentage of S, T, and Y residues at class I phosphorylation sites (localization probability ≥ 0.7). b Changes in chromatome signal for all modified histone peptides between G1 and mitosis. Boxplots represent peptides either acetylated at lysine residues (left), phosphorylated at S, T, or Y residues (middle) or trimethylated at lysine residues (right). The box represents the middle 50% of the data, the line inside the box represents the median, and whiskers are defined by the most extreme values lying within 1.5 times the interquartile range. Outliers are shown as points. Numbers below boxes represent the number of peptides at each modification level. The p-value for slope of the fit of log2(M/G1) changes regressed against the number of modifications is noted in the upper right corner for acetylated peptides (see Methods). c Changes in signal for protein groups involved in writing (top), erasing (middle) and reading (bottom) histone acetylation. Asterisks above each heatmap cell represent changes that are significant (p < 0.001, see Methods for significance determination). d Western blot of G1 and M chromatin fractions (left) with corresponding signal from triplicate MS measurements (right)

