Fig. 4.
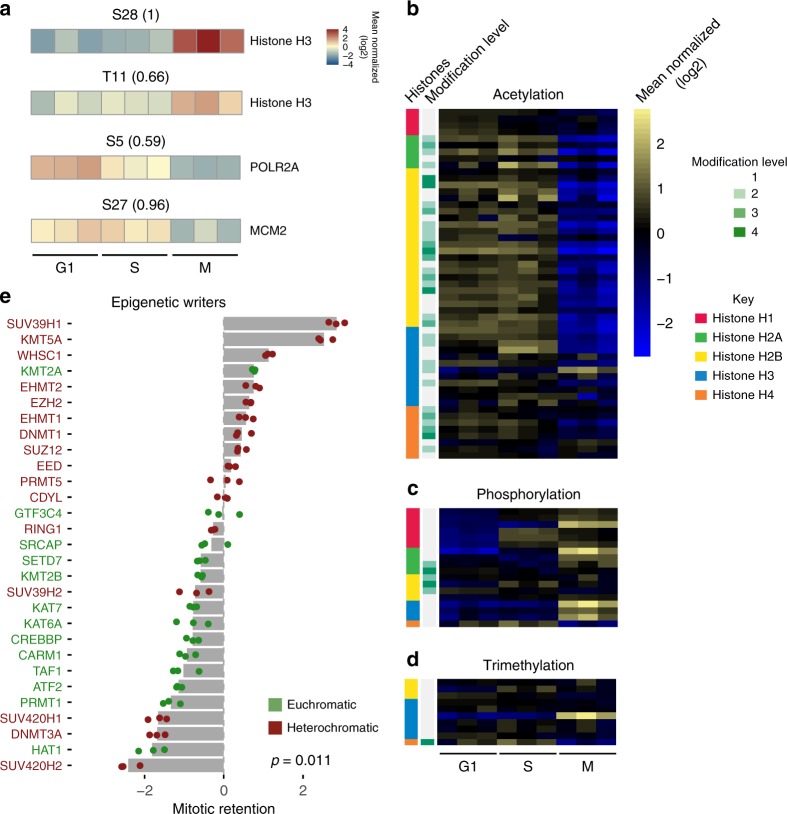
Differential binding of the epigenetic machinery during the cell cycle. a Changes in abundance for peptides in the chromatome. Top: Histone H3 phosphorylated at S28 or T11, Middle: RNA polymerase subunit POLR2A at serine 5 of the CTD repeats, Bottom: Serine 27 of MCM2. Numbers above denote the localization probabilities of phosphorylation. b–d Changes in histone acetylation (b), phosphorylation (c), and trimethylation (d) across cell cycle stages measured. The far-left annotation column denotes which histone the peptide was mapped to, the near left column (shades of green) denotes the number of modification events. Histone annotation has been simplified from possible isoforms for ease of interpretation. e Behavior of epigenetic writers between mitosis and G1. The x-axis is log2(M/G1) for each protein. Bars represent standard error of the mean. Red font represents proteins that tend to correlate with transcriptional repression, while proteins represented by green font represent proteins correlated with transcriptional activity. Significance between euchromatic and heterochromatic groups is noted on the bottom right (Wilcoxon rank-sum test)

