Fig. 5.
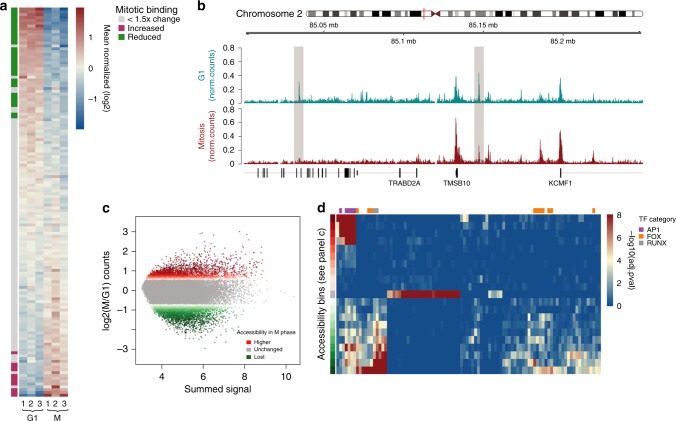
The regulatory landscape is largely retained on mitotic chromosomes. a Transcription factor binding dynamics between G1- and M-phase. Scale is mean normalized in log2 space. Factors significantly depleted in M-phase are indicated by the green annotation row and significantly enriched factors are denoted in red (p ≤ 0.001 and 1.5-fold change, see Methods for significance determination). b Screenshot of a 150 kb region, illustrating large scale conservation of the regulatory landscape. Shaded boxes represent local depletions in accessibility in mitosis. Scale is read counts normalized to library size. c Binning of distal peaks based on difference in accessibility between G1 and mitosis. Green and red points represent bins of reduced and increased accessibility in mitosis, respectively, while gray points represent unchanged peaks. d Enrichment of transcription factor motifs in bins shown in (c). Scale is −log10(adjusted p-value). Annotation column on top of the heatmap denotes transcription factors of the Fox and Runx families as well as AP1. Bins from panel (c) are represented by the annotation column on the far left

