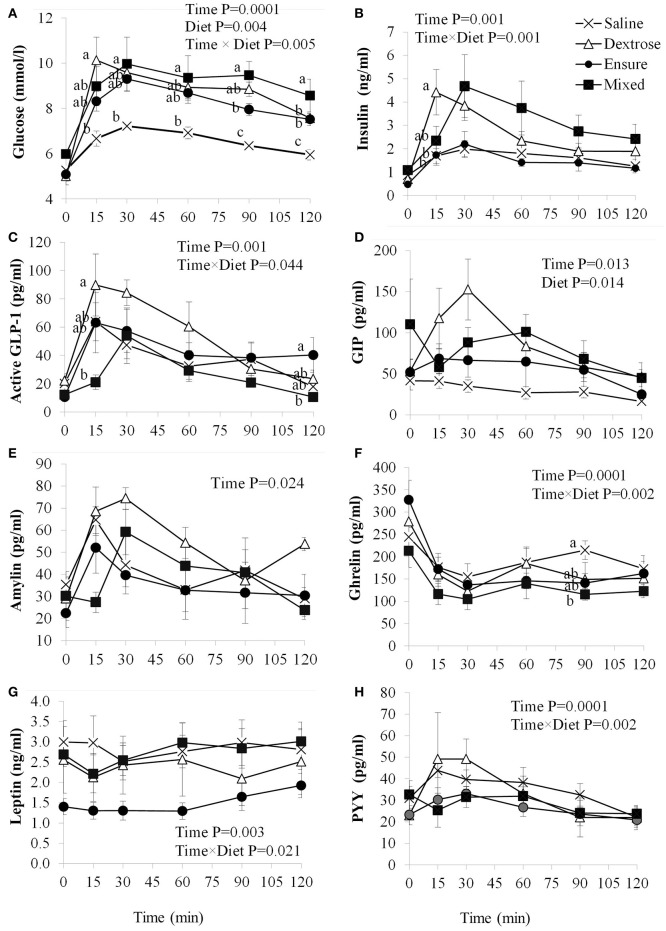
Figure 1.
Plasma glucose and satiety hormone response following an oral load of saline, dextrose, Ensure®, or a mixed meal. (A–H) Values are mean±SEM (n = 6). Differences between the oral solutions were measured using one-way ANOVA at each time point. Values with different superscripts are significantly different (P < 0.05).

