Figure 3.
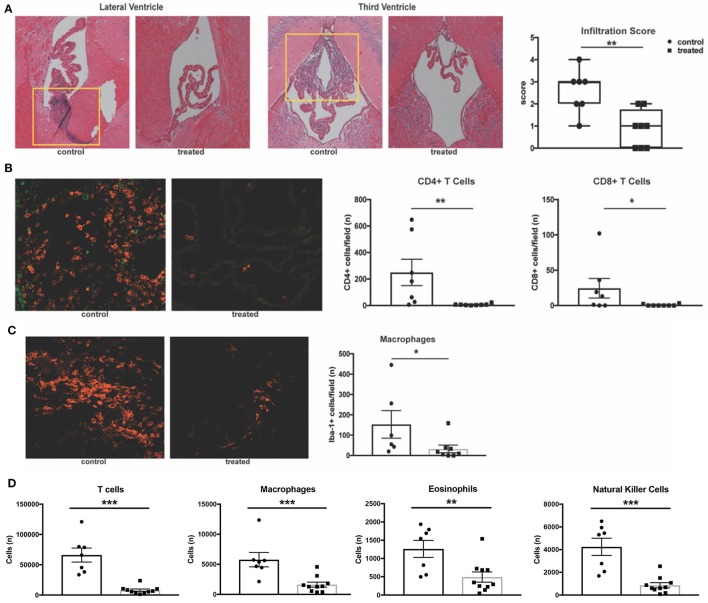
Fingolimod significantly reduces CNS infiltration. (A) Coronal sections of brains from fingolimod treated mice and controls were stained with H&E, and the choroid plexus was blindly scored for lymphocytic infiltration (10x magnification). Representative sections are shown. (B) Immunofluorescent staining of CD4+ T cells (magenta) and CD8+ T cells (green) and quantification of cells per field at 20x magnification. (C) Iba1+ macrophages (magenta) were also quantified at 20x magnification. Control treated, n = 7; Fingolimod treated, n = 8. (D) Quantification of infiltrating T cells, macrophages, eosinophils, and natural killer cells by flow cytometry from hemisected brain lysates. Control treated, n = 10; Fingolimod treated, n = 7. *p < 0.05, **p < 0.01, ***p < 0.001. Results are displayed as mean ± SEM.

