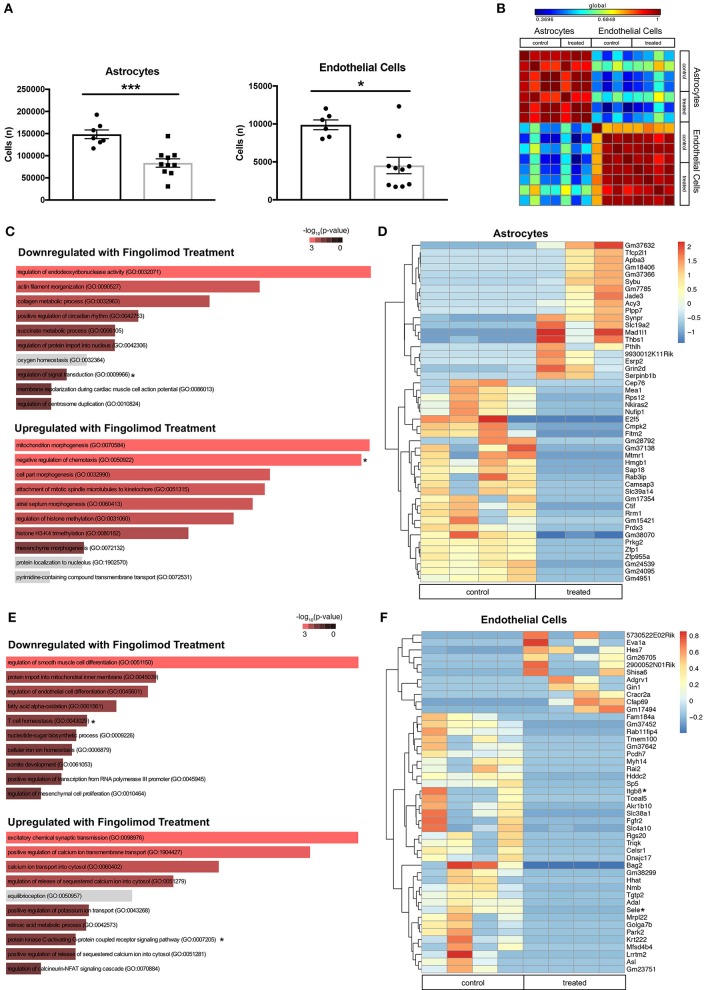
Figure 5.
Fingolimod downregulates expression of inflammatory genes in astrocytes and endothelial cells. (A) Quantification of astrocytes (left) and endothelial cells (right) purified by fluorescence-activated cell sorting. *p < 0.05, ***p < 0.001. Results are displayed as mean ± SEM. (B) Correlation matrix showing the differential expression of 12,000 genes demonstrates separation of astrocyte and endothelial cell samples. (C,E) Gene Ontology (GO) processes downregulated (top), and upregulated (bottom) in astrocytes (C) and endothelial cells (E) by fingolimod treatment. Significantly different processes are highlighted in red. Asterisks denote processes discussed in the text. (D,F) Heatmap of variably expressed genes that exhibited a significant difference (p < 0.05) between control and treated astrocytes (D) and endothelial cells (F) with a log2fold change of >6.5 and >5.5, respectively. Asterisks indicate genes discussed in the text. The color scale bar of the heatmaps reflects mean centered VST (Variance Stabilizing Transformation) units. (C,D) Control treated, n = 4; Fingolimod treated, n = 3. (E,F) Control treated, n = 4; Fingolimod treated, n = 4.

