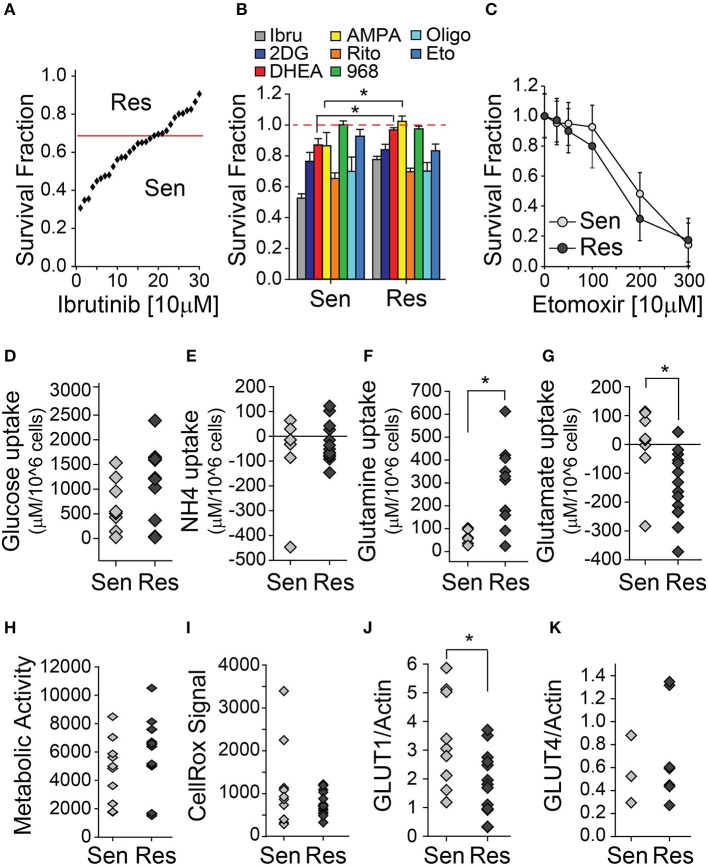
Figure 1.
CLL lymphocytes display metabolic differences associated with ibrutinib sensitivity. (A–C) Survival fraction (relative to non-treated control [NT]) of CLL lymphocytes treated with metabolic inhibitors for 48 h, (A) (n = 26), (B) (n = 15–26), (C) (n = 11), (mean ± SEM). Basal metabolite uptake differences between ibrutinib sensitive and resistant CLL lymphocytes, (D) Glucose (n = 20), (E) Ammonia (n = 22), (F) Glutamine (n = 16), (G) Glutamate (n = 23). Negative values indicate metabolite excretion to the media. (H) Basal raw (Resazurin) signal of mitochondrial reductive capacity of ibrutinib sensitive and resistant CLL lymphocytes (n = 25). (I) Basal raw ROS (CellRox) signal of ibrutinib sensitive and resistant CLL lymphocytes (n = 25). Basal protein expression of ibrutinib sensitive and resistant CLL lymphocytes (relative to actin signal) (J) GLUT1 (n = 22) and (K) GLUT4 (n = 10), *p < 0.05.

