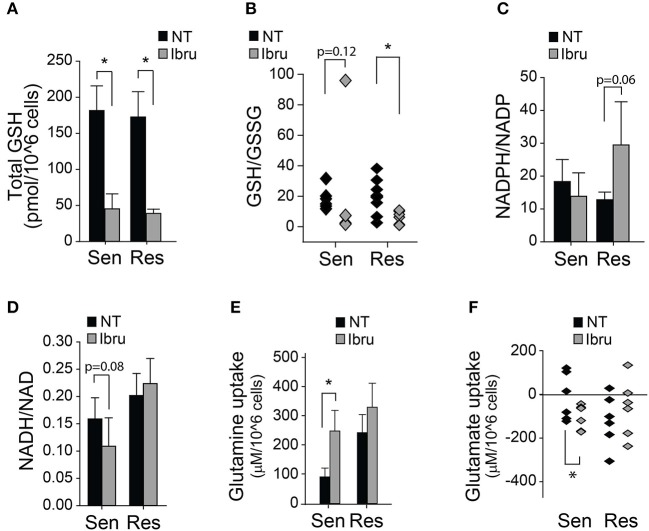
Figure 2.
Metabolic and Redox effects of ibrutinib on CLL lymphocytes. (A) Quantification of total glutathione after 24 h treatment with ibrutinib (n = 15), (mean ± SEM). (B) Reduced/Oxidized glutathione ratio after 24 h treatment with ibrutinib (n = 14). (C) NADPH/NADP ratio after 24 h of ibrutinib treatment (n = 8) (mean ± SEM). (D) NADH/NAD ratio after 24 h of ibrutinib treatment (n = 11) (mean ± SEM). Metabolite uptake after 24 h of ibrutinib treatment. (E) Glutamine (n = 21) and (F) Glutamate (n = 20) (mean ± SEM), *p < 0.05.

