Figure 3.
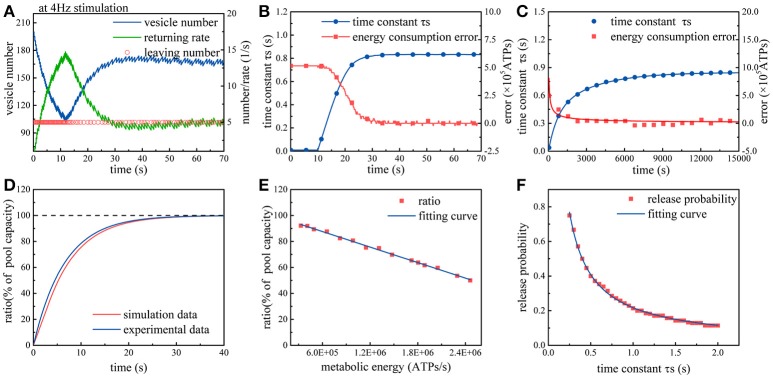
Simulation of the synaptic transmission model with the constraint. (A) Due to the constraint, the rate of synaptic vesicles leaving the recycling pool gradually declines to maintain the release probability within the range of 0.25~0.5. The rate of vesicles returning to the recycling pool varies with the rate of vesicles leaving the recycling pool. Once vs equals vr, the number of synaptic vesicles maintains a dynamic balance. (B) Under the constraint, the time constant τs gradually increases so that the difference between the actual metabolic energy consumption and the desired energy consumption (8.2 × 10⁵ ATP/s) tends to zero. (C) The model is repeatedly stimulated by action potential sequences. Each stimulation lasts for 50 s. The frequency of action potential sequences in each stimulation obeys an N(4, 1) Gaussian distribution. After the input of approximately three hundred stimuli, the synapse model gradually adapts to the stimulus signal. (D) The recovery of the recycling pool in which the vesicles are completely exhausted. The red curve represents the simulation results, and the dark blue curve represents the experimental results (Heidelberger et al., 2002). (E) Spike signals with the frequency of 4 Hz are continuously input into the model. When the number of vesicles in the recycling pool reaches dynamic balance, the ratio of the actual vesicle number to the maximum capacity of the pool varies with different synaptic energy level. (F) In the case that the frequency of action potential remains unchanged, the larger the time constant τs, the smaller the release probability.

