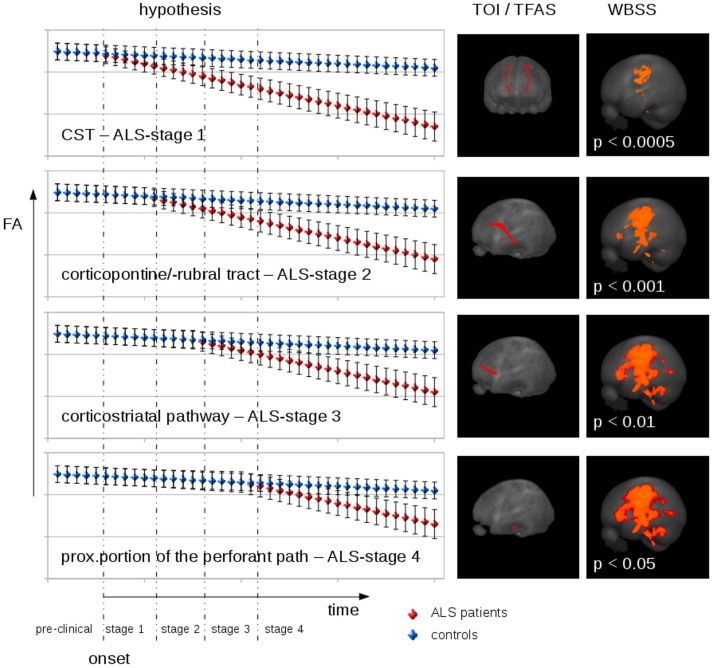
FIGURE 1.
Hypothetical FA development/decrease model for the mean FA values in ALS staging related tract systems. Left panel: At baseline, mean FA was supposed to be identical in patients and controls (with individual error bars). After a certain time interval after disease onset, FA alterations appear first in the CST (related to ALS stage 1). During the disease course, these FA alterations manifest, and FA alterations in frontal and prefrontal areas as well as in the brain stem are observed (corticopontine and corticorubral tract as well as corticostriatal pathway, related to ALS stages 2 and 3, respectively). With higher disease duration, FA alterations in the CST further decrease and alterations in hippocampal areas (proximal portion of the perforant path, related to ALS stage 4) contributed to the FA alteration pattern. Central panel: Projectional views of fiber tracts used for tractwise fractional anisotropy statistics (TFAS) for each of the four stages. Right panel: Projectional views of the corresponding whole brain-based spatial statistics (WBSS).

