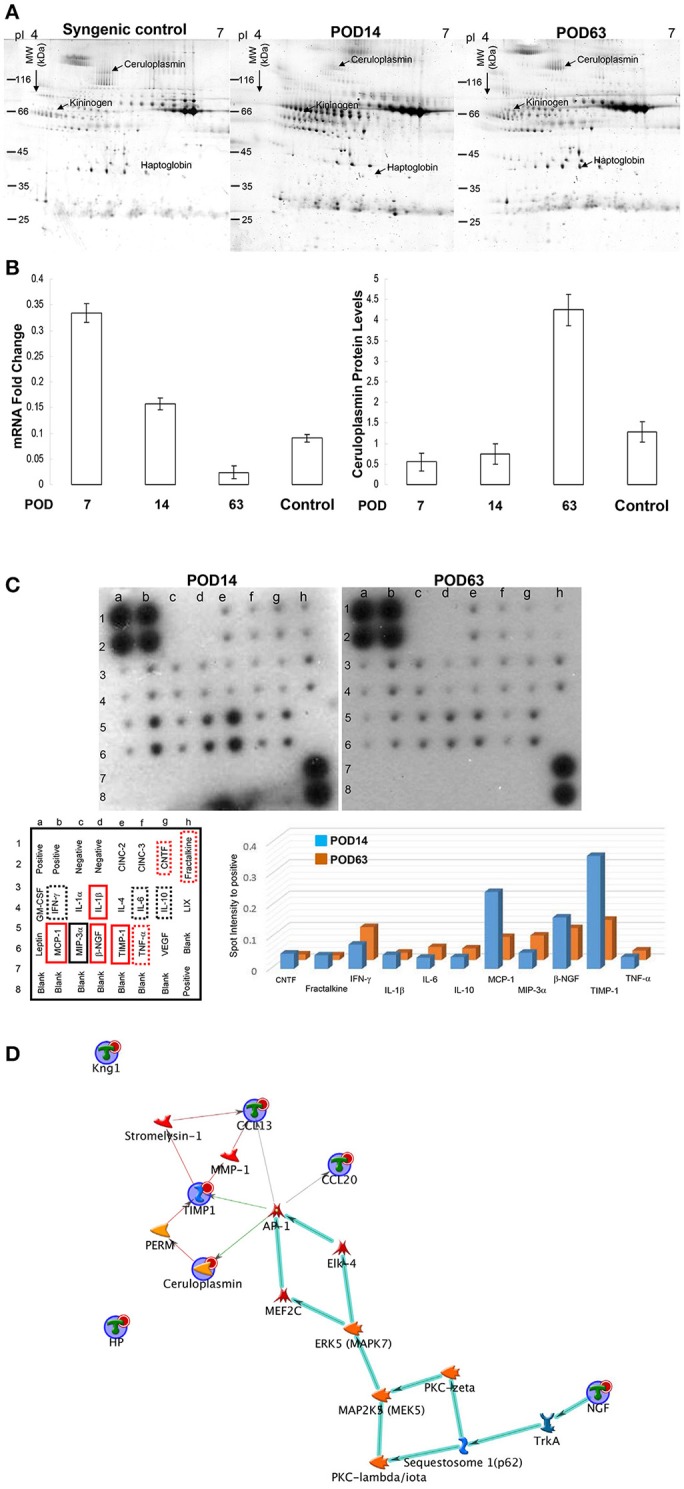
Figure 2.

(A) Typical 2-DE protein profiles of rat serum samples. The protein volume was determined, and their intensities were quantified by sliver-stained 2-DE (Nonlinear Progenesis software). (B) The mRNA and protein levels of ceruloplasmin were normalized and the results represent the mean ± SD of three independent experiments on POD7, 14, 63 and control sample (syngenic control). (C) Cytokine levels were assessed by protein array on POD14 and POD63. The internal positive and negative controls were compared among array exposures. Cytokine/chemokine levels were normalized with respect to positive controls on the array membrane. The red solid line rectangle indicating the significantly higher values of cytokines in the rejection group compared to the tolerance sample whereas the black solid line rectangle showed significantly reduced level of cytokines on POD14 compared to that on POD63. The dotted line rectangles indicating the signals were slightly different with no statistical significance. The quantitative results indicating the different values were demonstrated as a bar chart. (D) Network analyses of differentially expressed proteins were applied with MetaCore software. Nodes represent proteins and lines between the nodes indicate direct protein–protein interactions. The various proteins on this map are indicated by different symbols demonstrating the functional class of the proteins. The biologic pathways in this network are mainly involved in immune regulation.
