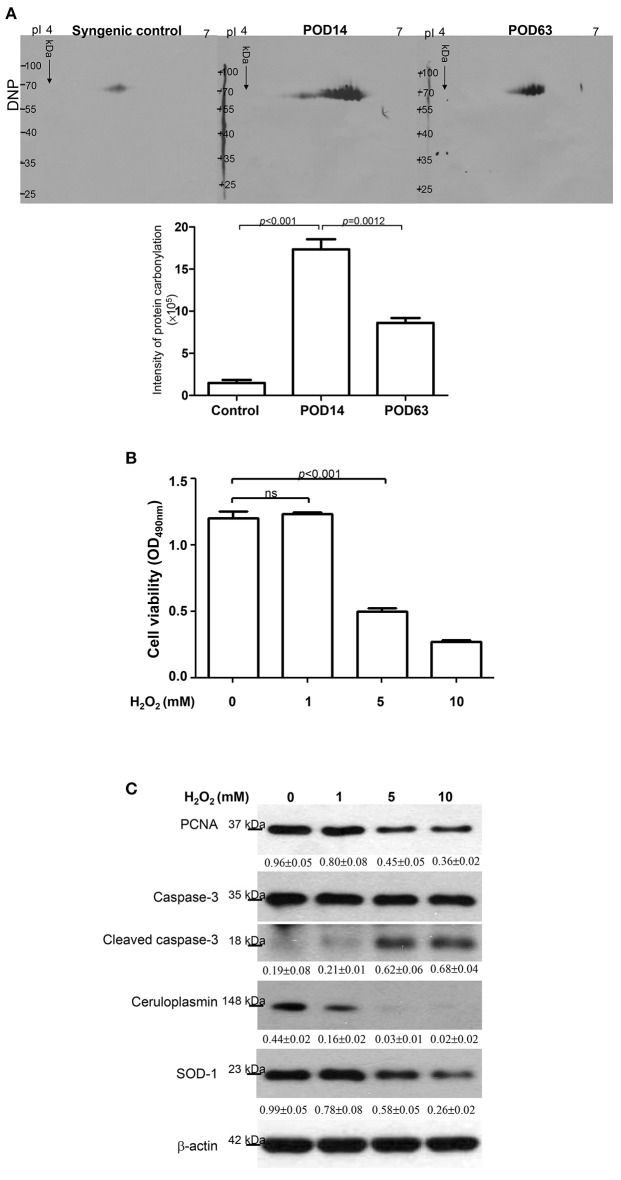
Figure 3.
(A) Images of the 2-DE oxyblot. Analysis of protein oxidation levels in DNP-derivatized proteins among syngenic control, POD14 and POD63 samples. Obvious reduction in the carbonylation levels of proteins are observed in the tolerance group compared to rejection group. The quantitative results indicating the differentially carbonylated level of protein on syngenic control, POD14 and POD63 were demonstrated as the bar chart. (B) HepG2 cell viability was determined under the treatments of 0, 1, 5 and 10 mM H2O2. The result was quantified and indicated by the bar chart. (C) Western blotting analysis for PCNA, caspase-3, ceruloplasmin and SOD-1 levels under treatment of different concentrations of H2O2. The relative expression ratio to β-actin is shown at the bottom.

