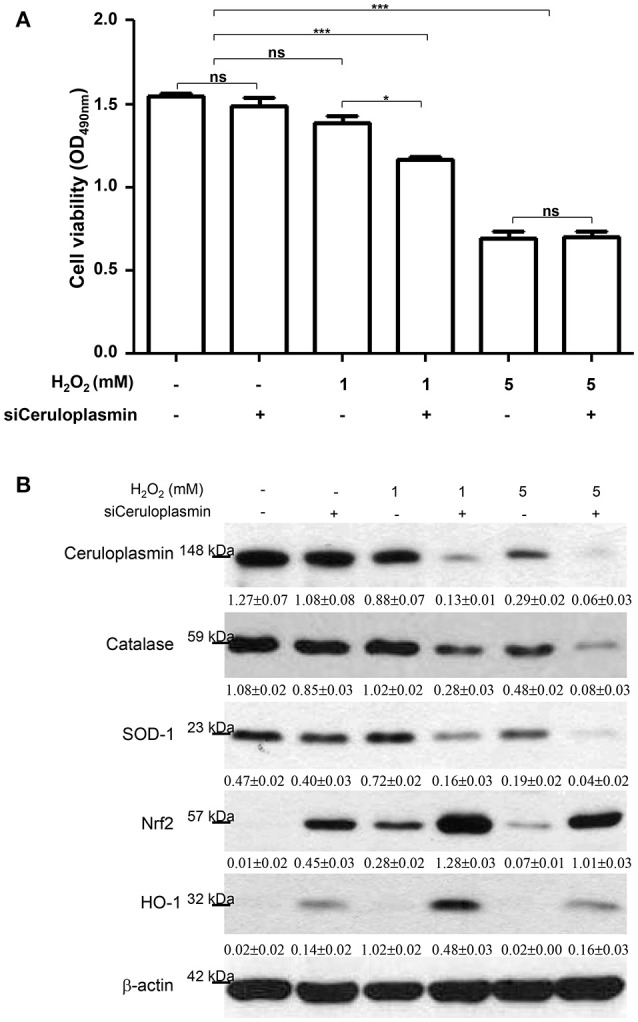
Figure 4.

(A) HepG2 cell viability was determined under the treatments of 0, 1, and 5 mM H2O2 with or without ceruloplasmin siRNA (siCeruloplasmin) application. Results represent the mean ± SD of three independent experiments (*p < 0.05, ***p < 0.001). (B) The regulation of antioxidant enzymes and associated molecules under the administration of 0, 1, and 5 mM H2O2 with or without ceruloplasmin siRNA. β-actin was applied as the loading control. The relative expression ratio to β-actin is shown at the bottom.
