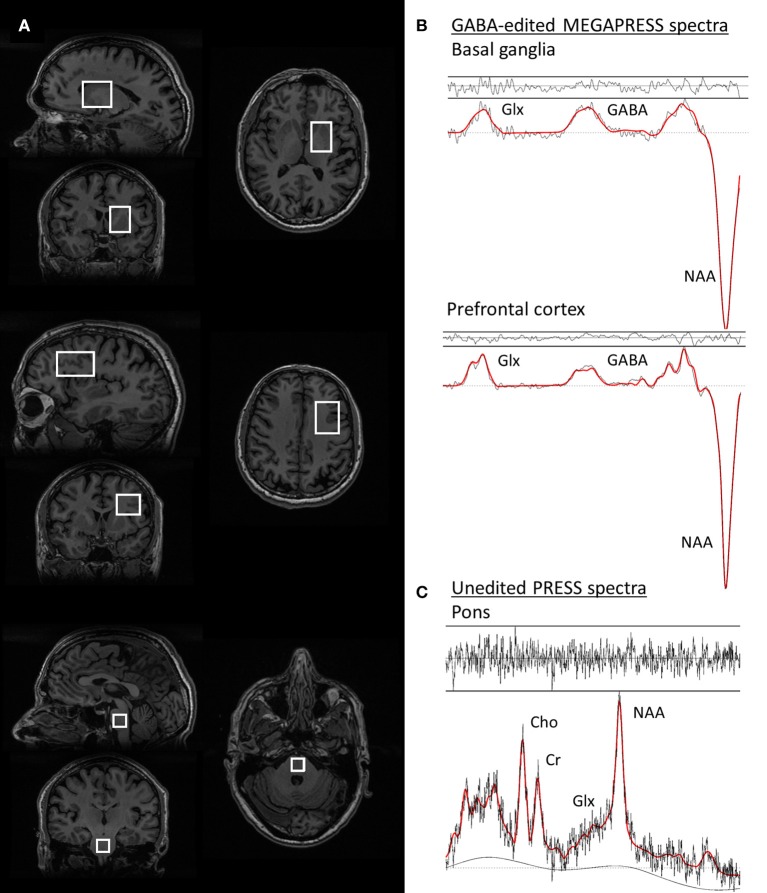
Figure 1.
Voxel positions and representative spectra from one PD patient. (A) voxel positions from the basal ganglia, prefrontal cortex, and pons voxels, respectively. (B) GABA-edited MEGAPRESS spectra from the basal ganglia (top) and prefrontal cortex (middle). The spectral data are plotted in black and the LCModel fit for each spectrum is overlaid in red. (C) PRESS spectrum from the pons, with the LCModel fit overlaid in red. For all spectra, the residuals of the fit are plotted above each spectrum.

