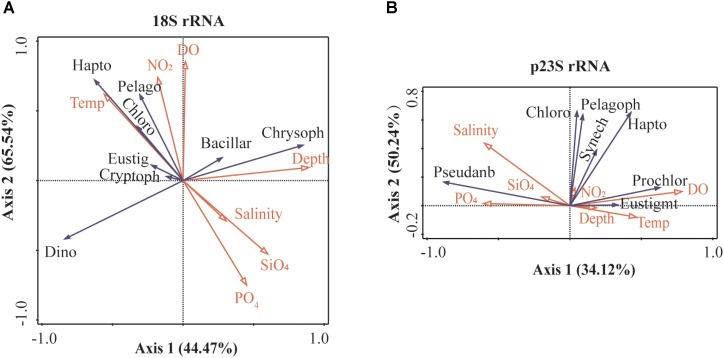
FIGURE 6.
Redundancy analysis (RDA) diagram illustrating the relationship between PN community and environmental factors in the Mariana Trench. (A) 18S rRNA gene assemblage and (B) plastid 23S rRNA gene assemblage. The OTUs with relative abundances >0.01% were used in this analysis. Bacillar, Bacillariophyta; Chloro, Chlorophyta; Chrsop, Chrysophyceae; Crypto, Cryptophyceae; Dino, Dinoflagellata; Eustig, Eustigmatophyceae; Hapto, Haptophyta; Pelago, Pelagophyceae; Prochlor, Prochloraceae; Pseudanb, Pseudanabaenaceae; and Synechoc, Synechococcaceae.

