
FIGURE 5.
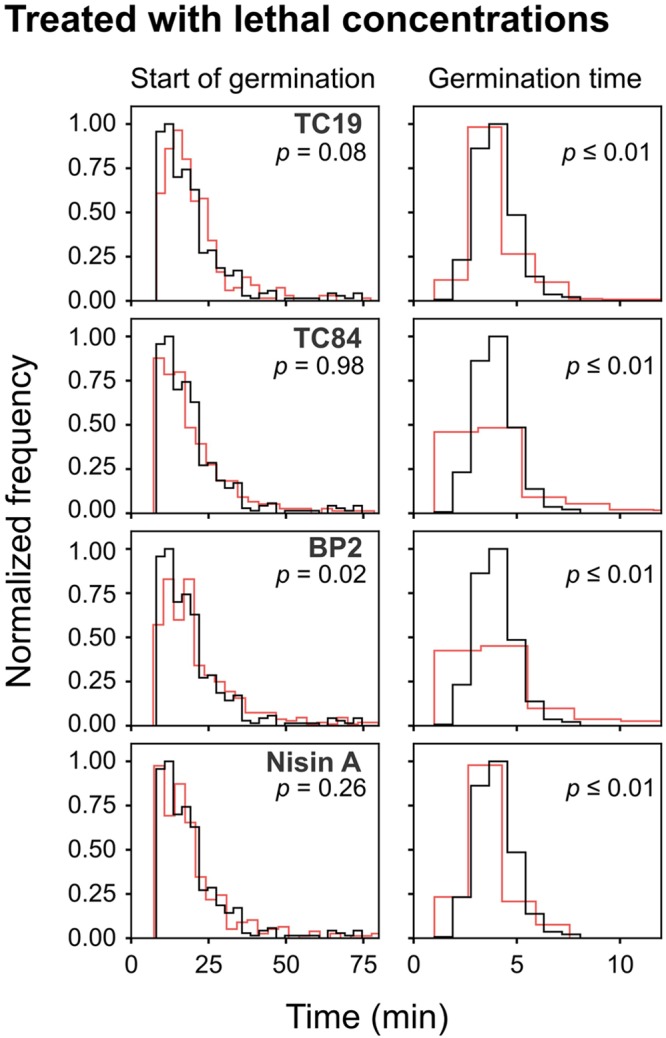
Frequency distribution curves of B. subtilis spores treated with lethal peptide concentrations. Lethal peptide concentrations were 32 μM TC19, 23 μM TC84, 56 μM BP2, and 7 μM Nisin A. Treated conditions (red line) were overlaid with untreated conditions (black line). The histogram was normalized to occupy an area of one and was rescaled so that the maximum value in the histogram is equal to one. Significance was determined using the Mann–Whitney test, where a statistically significant difference, with a p-value ≤0.05, is obtained if the median values between the two groups are greater than would be expected by chance. Observations of two biological repeats were grouped and analyzed as one data set.