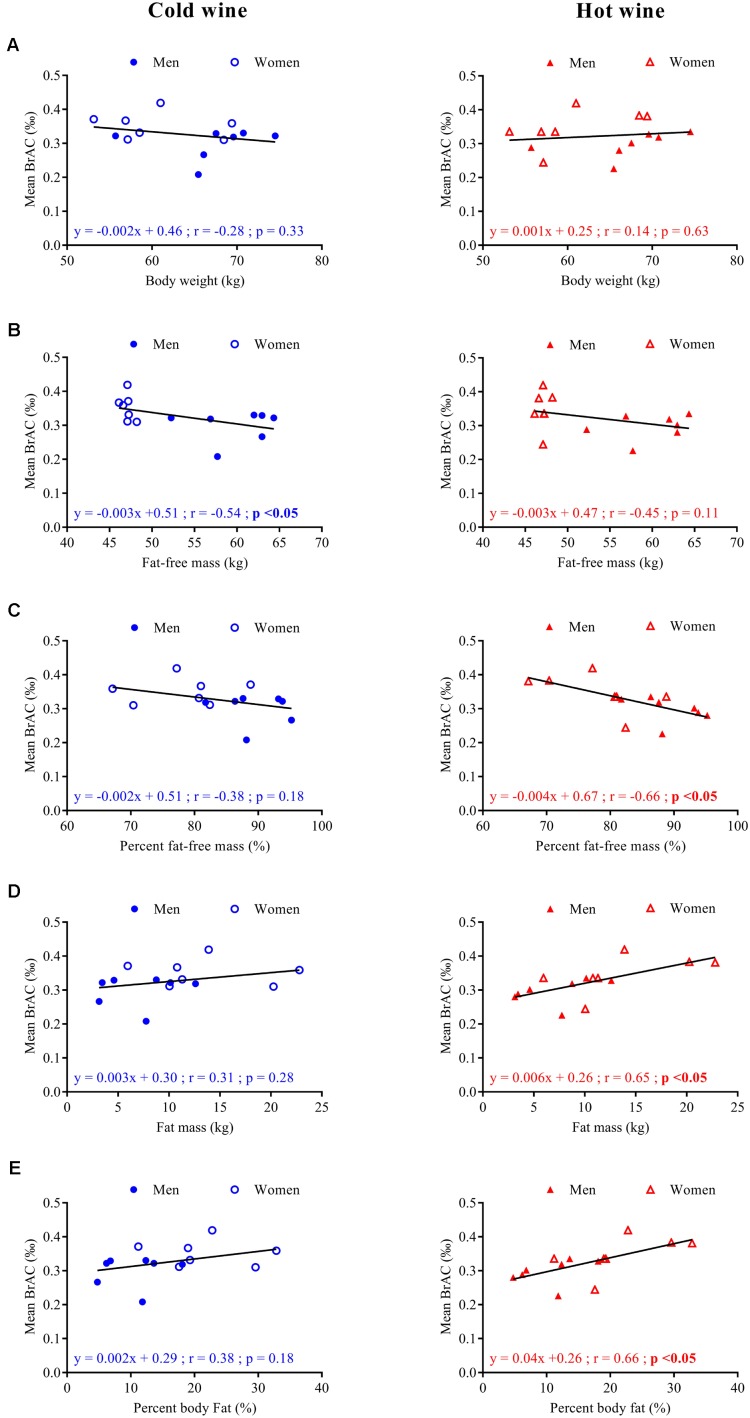
FIGURE 3.
Correlation analysis for seven men ( ,
,  ) and seven women (
 , Δ) between mean BrAC[20-120]
min after cold (left panels, blue symbols) and hot (right panels, red symbols) wine ingestion and body weight (A), fat-free mass in kg (B), percent fat-free mass (C), fat mass in kg (D), and percent body fat (E). Regression lines (—), equations of the linear regressions, correlation coefficients (r), and p-values were obtained for 14 subjects.

