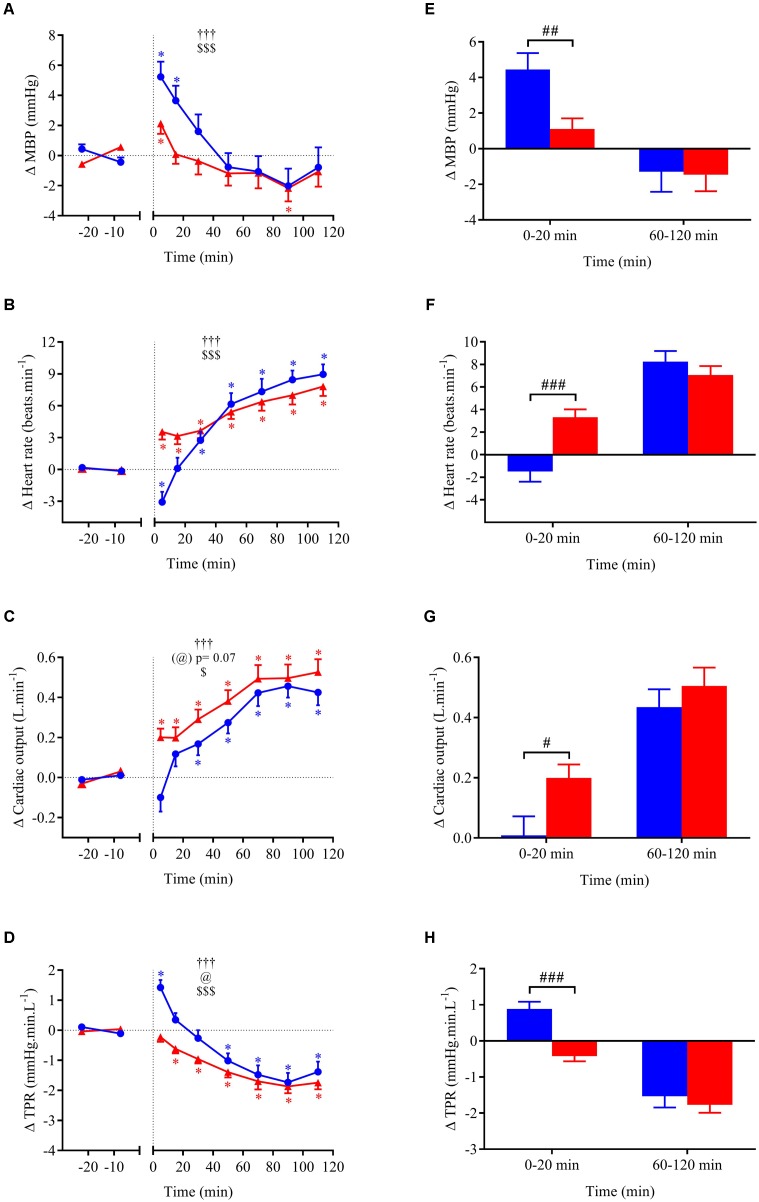
FIGURE 4.
(A–D) Time course of the changes in MBP, heart rate (HR), cardiac output (CO), and total peripheral resistance (TPR) presented as delta (i.e., absolute changes relative to baseline levels). (E–H) Mean responses averaged over 0–20 and 60–120 min post-drink periods presented as delta (i.e., average over 0–20 and 60–120 min post-drink minus the average over the 30-min baseline period, respectively). Drinks: cold wine ( ,
,  ); hot wine (
 ,
,  ). Values are mean ± SEM. Symbols for ANOVA analysis: †, time effect; @, temperature effect; and $, time × temperature interaction effects. ∗Significant difference over time from baseline values. #Significant difference between drink conditions (cold vs. hot). The level of significance for all symbols was mentioned as follows: one symbol (p < 0.05), two symbols (p < 0.01), and three symbols (p < 0.001).

