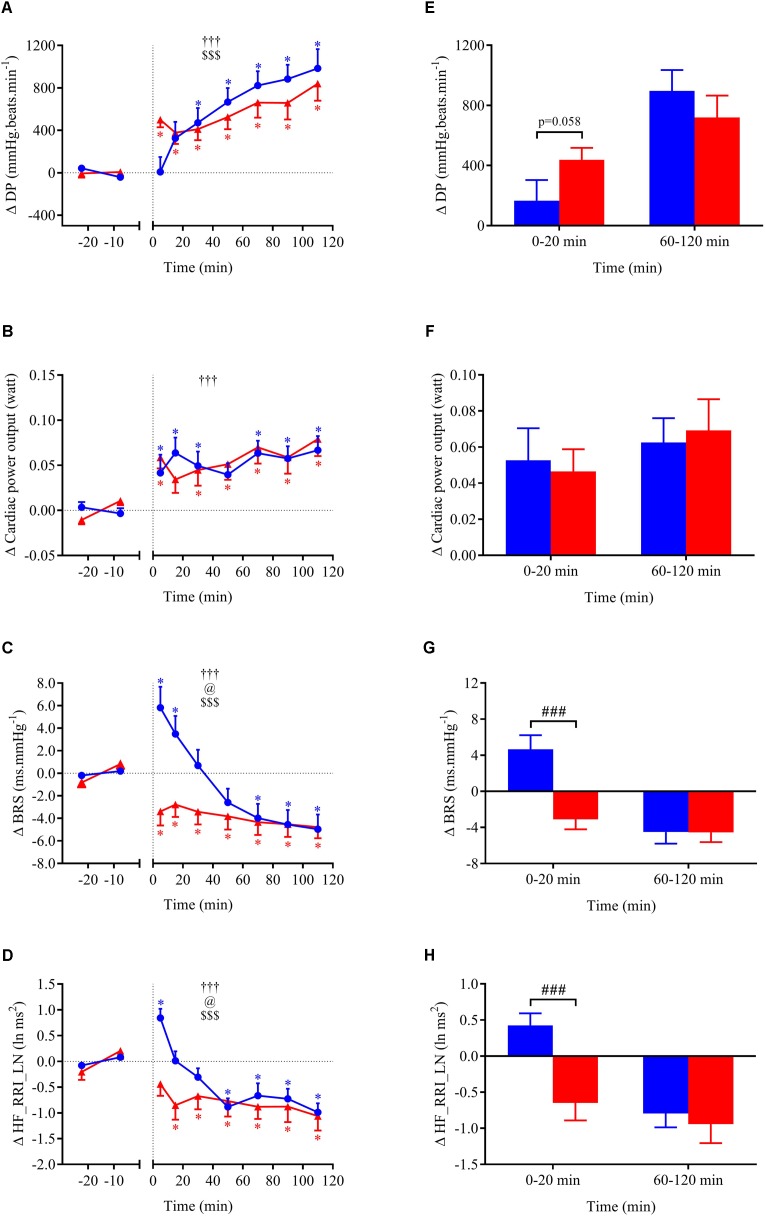
FIGURE 5.
(A–D) Time course of the changes in double product (DP), cardiac power output (CPO), baroreflex sensitivity (BRS), and high-frequency power components of RR intervals (HF_RRI_LN) presented as delta (i.e., absolute changes relative to baseline levels). (E–H) Mean responses averaged over 0–20 and 60–120 min post-drink periods presented as delta (i.e., average over 0–20 and 60–120 min post-drink minus the average over the 30-min baseline period, respectively). Drinks: cold wine ( ,
,  ); hot wine (
 ,
,  ). Values are mean ± SEM. Symbols for ANOVA analysis: †, time effect; @, temperature effect; and $, time × temperature interaction effects. See legend of Figure 4 for level of significance.

