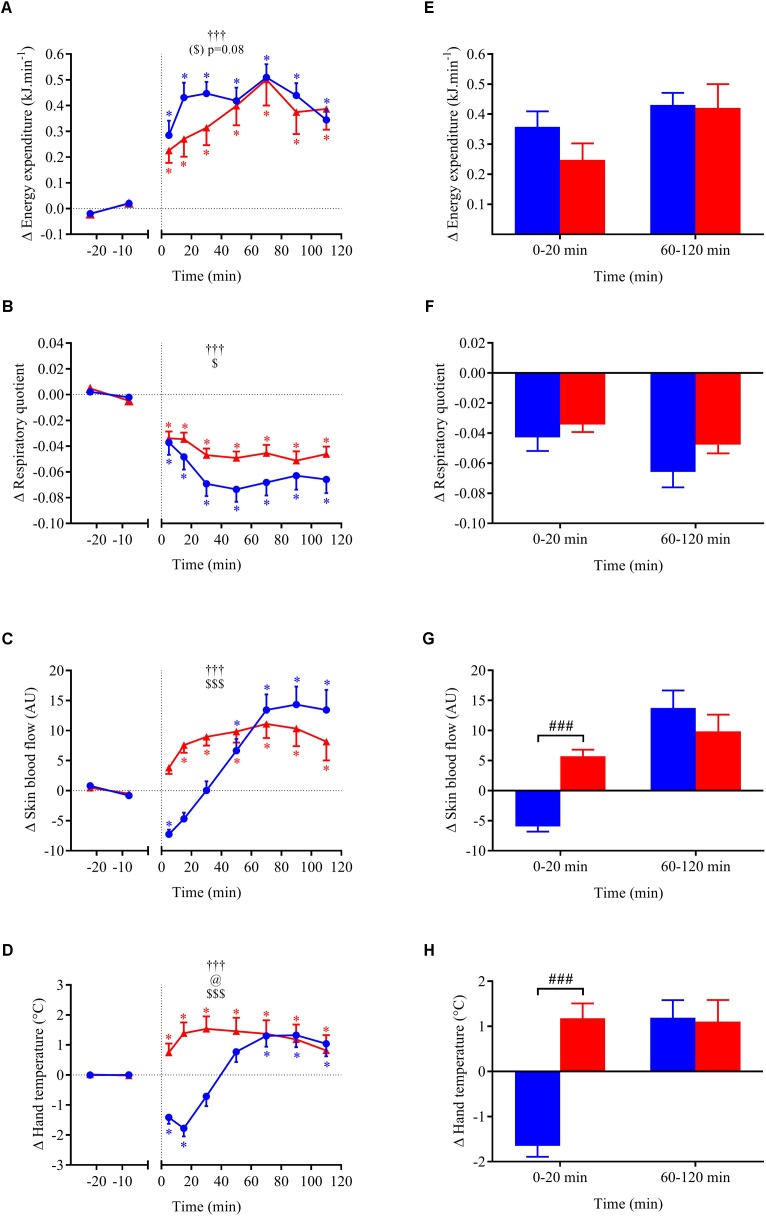
FIGURE 6.
(A–D) Time course of the changes in energy expenditure, respiratory quotient, skin blood flow, and hand skin temperature presented as delta (i.e., absolute changes relative to baseline levels). (E–H) Mean responses averaged over 0–20 and 60–120 min post-drink periods presented as delta (i.e., average over 0–20 and 60–120 min post-drink minus the average over the 30-min baseline period, respectively). Drinks: cold wine ( ,
,  ); hot wine (
 ,
,  ). Values are mean ± SEM. Symbols for ANOVA analysis: †, time effect; @, temperature effect; and $, time × temperature interaction effects. See legend of Figure 4 for level of significance.

