
Figure 2.
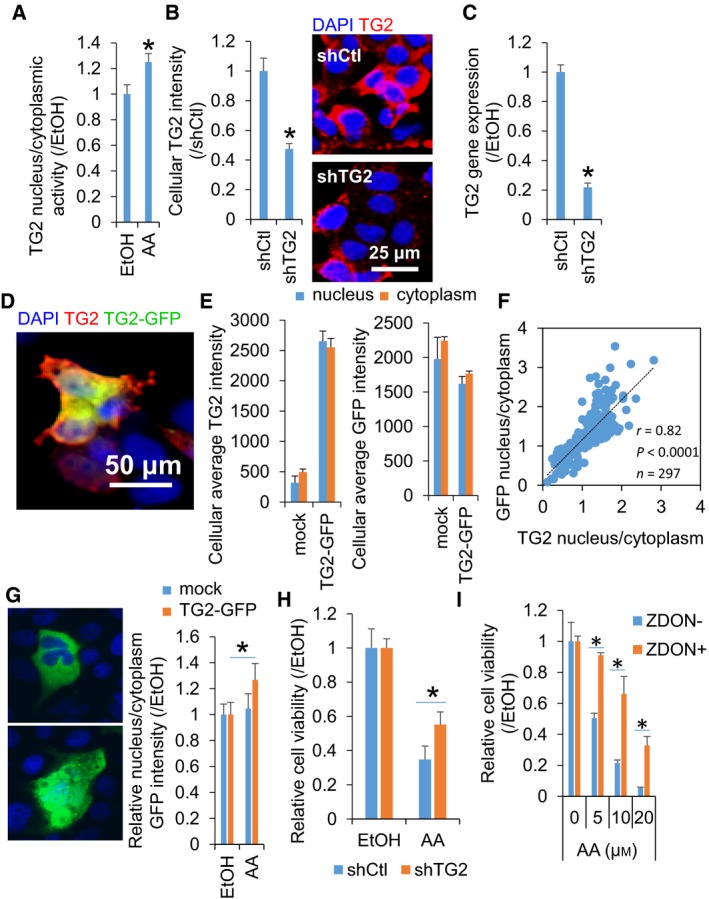
The suppression of TG2 activity prevented AA‐suppressed growth in hepatic cells. (A) Quantitative data regarding the nucleus/cytoplasm activity of TG2 in JHH7 cells treated with 20 μm AA for 24 h. The cellular activity of TG2 was measured as fluorescence intensity resulting from the TRITC‐based incorporation of 5‐BAPA. (B) Quantitative data (left panel) and representative images (right panel) of immunofluorescence staining and (C) gene expression for TG2 in JHH7 cells transduced with control (shCtl) or TG2 (shTG2) shRNA lentiviral particles. Scar bar: 25 μm. (D ~ H) JHH7 cells whose endogenous TG2 was knocked down with shTG2 and in which GFP‐TG2 was overexpressed (GFP‐TG2‐transfected shTG2 JHH7 cells). (D) A representative image of immunofluorescence staining for TG2. Scar bar: 50 μm. (E) Changes in cellular TG2 levels in the cells after treatment with 5 μm AA for 16 h. Cellular TG2 and GFP intensities in mock‐ or GFP‐TG2‐transfected shTG2 JHH7 cells. Data are presented as fluorescent intensities in the nucleus and cytoplasm, separately. (F) Correlation between the nucleus/cytoplasm intensity ratios of TG2 and GFP in the GFP‐TG2‐transfected shTG2 JHH7 cells. (G) The enhanced nuclear translocation of TG2 in the GFP‐TG2‐transfected shTG2 JHH7 cells upon treatment with 5 μm AA for 16 h. Scar bar: 10 μm. (H) The cell viability of shCtl and shTG2 JHH7 cells upon treatment with 10 μm AA for 24 h. (I) The cell viability of JHH7 cells upon treatment with increasing concentrations of AA (as indicated) in the absence or presence of 50 μm ZDON for 24 h. The data are presented as means (n = 3–4 replicates) ± SD; *P < 0.05, Student's t‐test.