Figure 2.

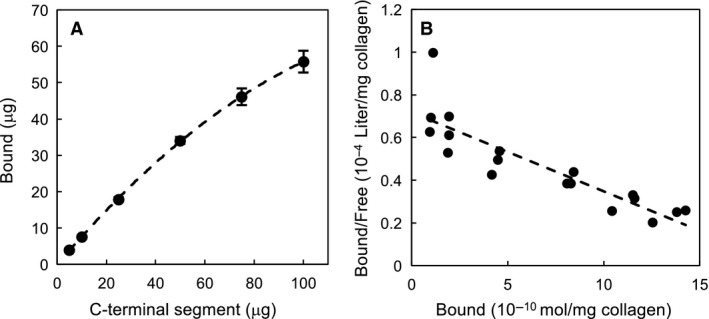
Scatchard analysis of the binding of the C‐terminal segment. Varying concentrations (0.1–2.0 mg·mL−1) of the C‐terminal segment were incubated in 50 μL of the binding buffer with a fixed amount (2.5 mg) of insoluble collagen fibers. After incubation, the filtrate containing unbound proteins was subjected to SDS/PAGE, and the amount of the unbound C‐terminal segment was determined by densitometry of the corresponding band. The results obtained by triplicate assay were analyzed on a Scatchard plot. (A) Saturation binding curve for collagen binding of the C‐terminal segment. (B) Scatchard plot for collagen binding of the C‐terminal segment.
