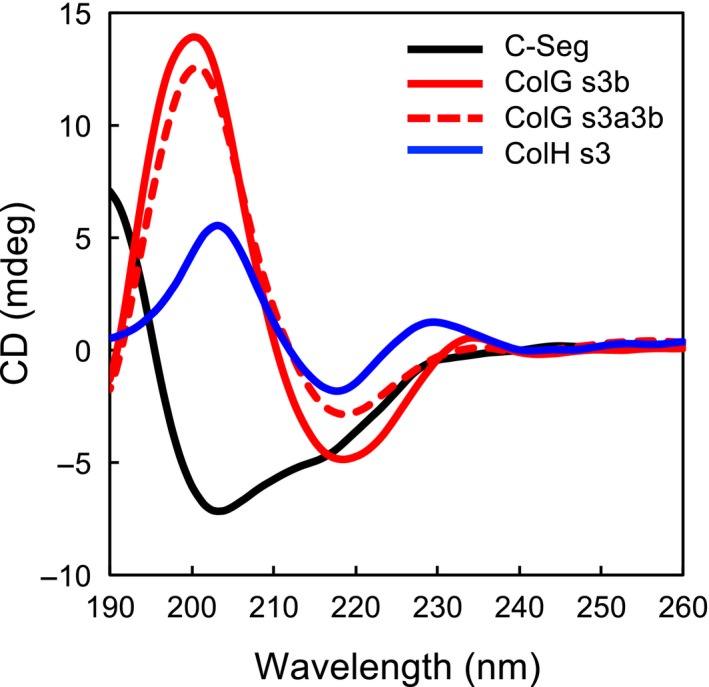
Figure 5.

CD spectra of the C‐terminal segment and the CBDs from H. histolytica. The CD spectra were measured at 20 °C in 10 mm phosphate, pH 7.5 for the C‐terminal segment (black line), ColG s3b (red solid line), ColG s3a3b (red dashed lines), and ColH s3 (blue line). The concentrations of the C‐terminal segment and the CBDs from H. histolytica were 0.1 mg·mL−1.
