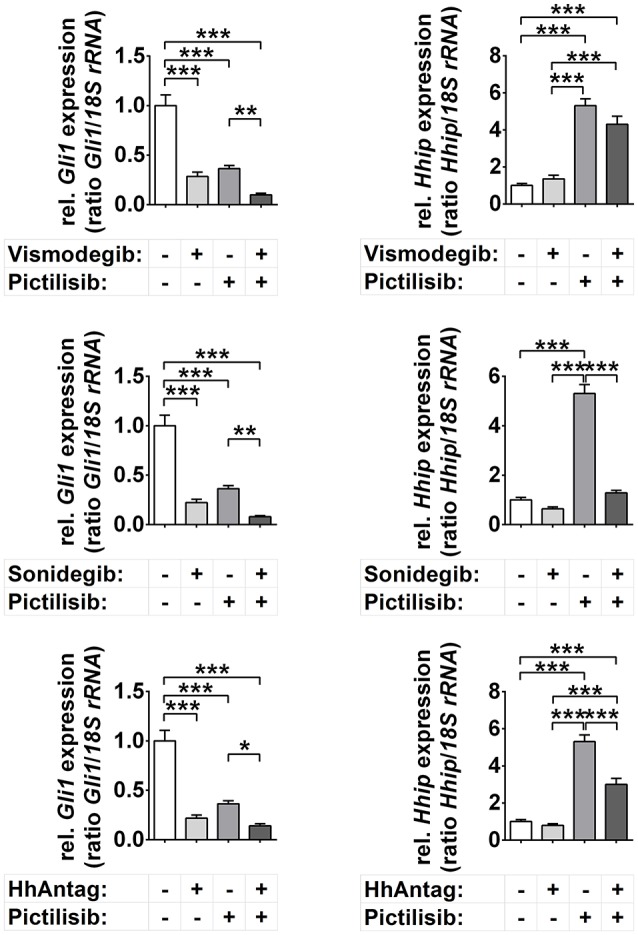
Figure 1.

Effects of Smo and/or Pi3k inhibition on Hh target gene expression. Gli1 and Hhip expression in cells treated for 48 h with 10 μM vismodegib, 10 μM sonidegib, 10 μM HhAntag or 5 μM pictilisib. Bars represent the mean +s.e. of three independent experiments measured in duplicates. *P < 0.05, **P < 0.01, ***P < 0.001 when analyzed by Tukey's test for multiple comparisons.
