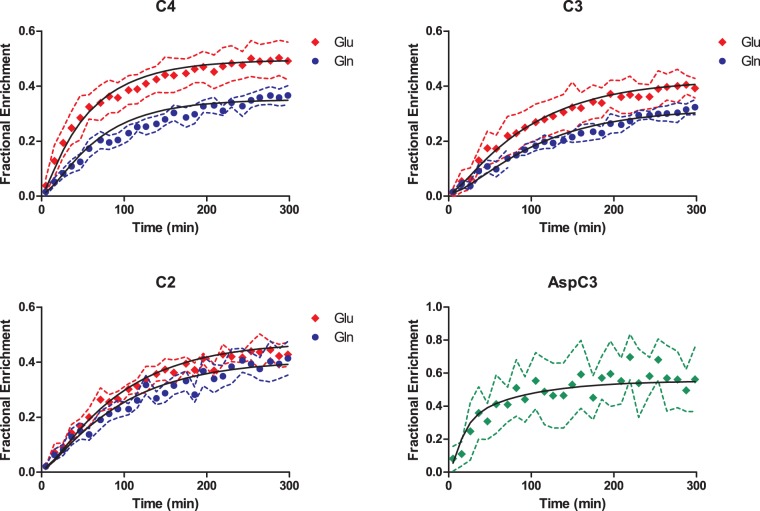
Figure 4.
Fractional enrichment curves of Glu and Gln at the position C4, C3, and C2 and Asp C3 as fitted to the neuro-glial compartmental model (Figure 1(a)). The black solid line represents the best fit as obtained by least square fitting. Dashed lines represent SD range determined from MC simulation for each experimental curve.

