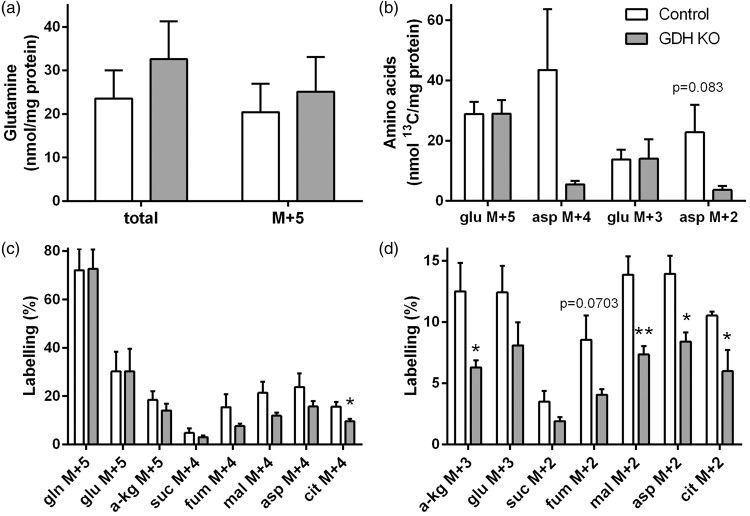
Figure 3.
Metabolism of [U-13C]glutamine in GDH KO neurons. Control (white) and GDH KO (grey) neurons were incubated with [U-13C]glutamine and the cell extracts were analyzed for amino acid contents by HPLC (a, b) and for percent 13C labelling by GC-MS (a, c, d). (b) Amounts of 13C labelling (nmol 13C/mg protein) glutamate M + 5 and M + 3 and aspartate M + 4 and M + 2 are presented. The labelling patterns derived from [U-13C]glutamine (M + 5) after conversion to glutamate M + 5 and subsequent entrance into the TCA cycle by direct labelling are as shown in Figure 2(b) and (d). The legend in (b) applies to all panels. Asp, aspartate; cit: citrate; fum, fumarate; gln, glutamine; glu, glutamate; mal, malate; suc, succinate; α-kg, α-ketoglutarate. (n = 3–5 independently prepared neuron cultures per condition.)

