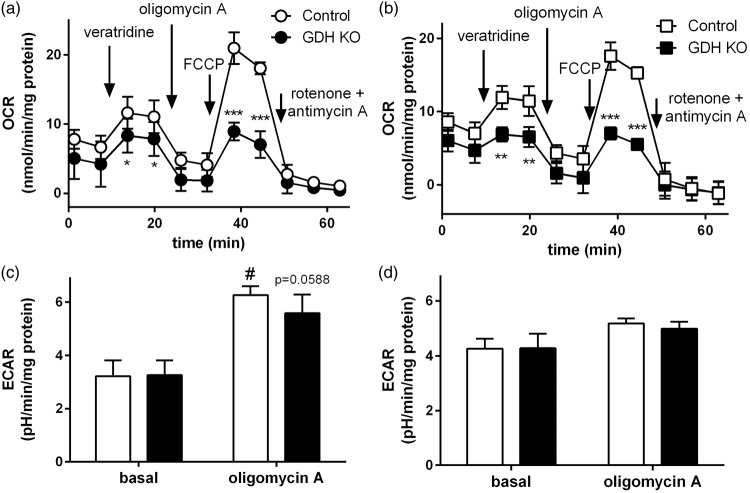
Figure 6.
Respiration (OCR) and lactate release (ECAR) of GDH KO synaptosomes. Synaptosomal OCR was monitored in control (white) and GDH KO synaptosomes (black) in the presence of glucose alone (a) or glucose + glutamine (b). Veratridine (5 µM), oligomycin A (12 µM), FCCP (4 µM), and rotenone (2 µM) + antimycin A (2 µM; all final concentrations) were added at the time points indicated by the arrows. Panels (c) and (d) show the basal and oligomycin A-dependent ECAR as average of the 2 time points of the time-dependent measurement of ECAR in control and GDH KO synaptosomes (time dependency not shown) in the presence of glucose alone (c) or glucose + glutamine (d). (n = 3 independently prepared synaptosome preparations per condition.)

