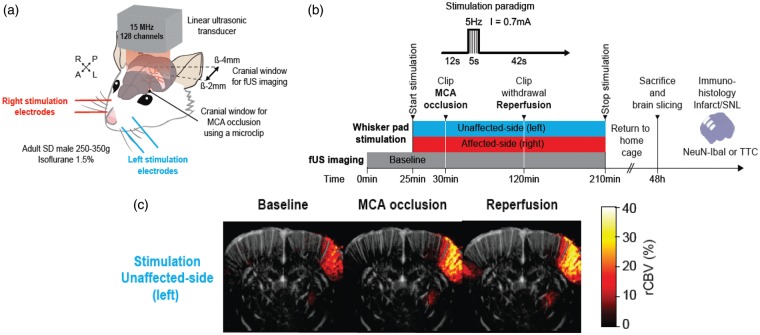
Figure 1.
(a) 3D view of the rat head showing the coronal craniotomy (brown-shaded band) drilled between bregma −2.0 and −4.0 mm and extending 6.5 mm on each side from the sagittal suture for fUSi acquisition. The ultrasonic probe was positioned above the coronal craniotomy. This coronal plane was selected based on the Paxinos and Watson stereotaxic atlas32 in order to include the S1 barrel field, i.e. the stimulation target. A smaller round-shaped 1 mm2 craniotomy was performed at bregma +2.0 mm, lateral +7.0 mm to access the left MCA to place the microclip used for occlusion (black dot). Two pairs of stimulation electrodes (blue and red) were inserted in the whisker pads for stimulation of the unaffected and affected side, respectively. The stimulated area is shown in light gray shade. (b) Schematic representation of the experiment timelines. After baseline fUSi data acquisition (duration: 30 min which included the three runs of left and right whisker pad stimulation in the last 5 min), the left MCA was occluded (black arrowhead) for 90 min and the clip was then released (black arrowhead). Whisker pad stimulations (red and blue bars for left and right whisker pad stimulation, respectively) are depicted across the baseline, occlusion and reperfusion conditions. Each side was alternatively stimulated three times during the baseline period, and every 2 min throughout the occlusion and reperfusion periods. Interruptions in the stimulation bars represent the short time periods where the rat was removed from the experimental set-up to allow proceeding with MCAo and recanalization. Throughout the baseline, occlusion and reperfusion periods fUS images were acquired continuously every 0.7 s, except during the MCAo and reperfusion clip manipulations. After fUS imaging, rats were returned to their home cage for 48 h until perfusion-fixation for and immuno-histochemistry (see Methods) to assess infarction and selective neuronal loss (SNL); (c) Coronal fUSi image with superimposed “activated” pixels in response to whisker pad stimulation of the unaffected-side (left) whisker pad during baseline (image shown on the left), generated according to the voxel-based image processing procedures described in Methods. Activations are shown in % CBV increase compared to baseline (pseudo-colour scale on right of image). For illustration, similar images obtained during MCA occlusion and after reperfusion are also presented (middle and right, respectively), showing markedly increased contralesional rCBV responses to whisker stimulation in both conditions. Scale bar = 2.5 mm.

