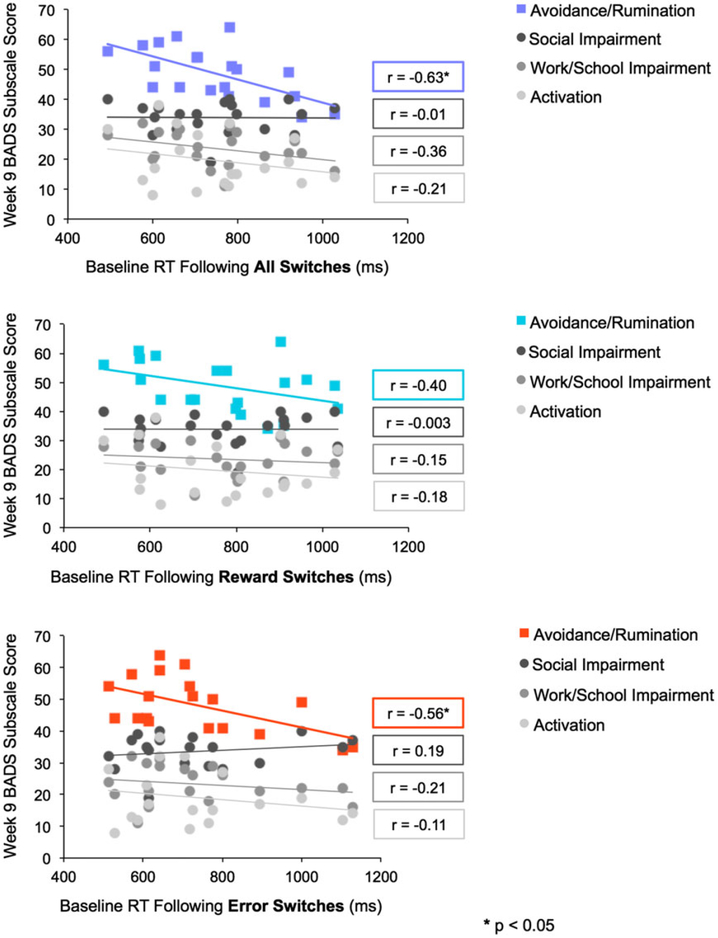
FIGURE 2.
Plots indicating the correlation between baseline response time following switches, reward switches, and error switches and score at the end of treatment with Engage on each subscale of the BADS [Colour figure can be viewed at wileyonlinelibrary.com]

