
Figure 2.
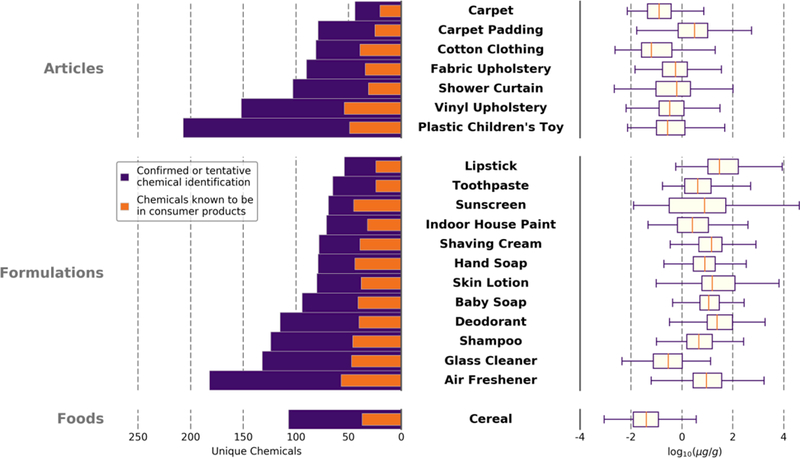
The number of unique chemicals within each category is shown by the bar chart (left). The total number of confirmed or tentative chemical identifications are compared to the number of those chemicals already known to be in consumer products (i.e., CPCPdb). The range of estimated concentrations are shown by the box plot (right) for all confirmed or tentative identifications for each product category. The upper pane represents articles, the middle represents formulations, and the lower pane represents foods.