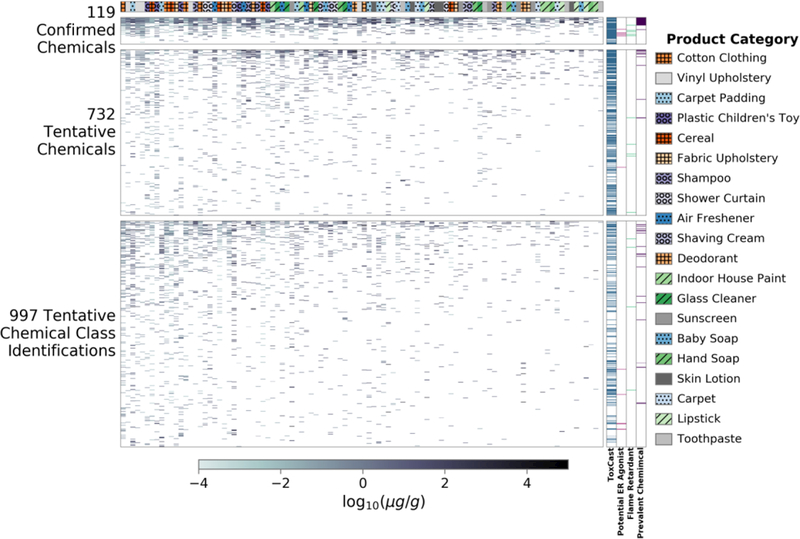
Figure 3.

Estimated concentration of chemicals in the tested products. Each one of the product samples is a column of the heat map, while there are 1848 rows corresponding to all identified spectral matches from the SSA. Some chemicals could be confirmed (by analytical standards) in some samples, but only tentatively identified (by spectral match) in others. The bars to the right of the heat maps show if a spectral match appeared in the ToxCast library, was a potential ER agonist, was a known flame retardant, or was prevalent (i.e., identified in 25 or more products) in the products examined in this SSA. The bar to the top of the heat map shows the product category in which a spectral match was identified. Spectral matches in each heat map are sorted such that those occurring in the most products are at the top. Products are sorted such that products with the most spectral matches are on the left. The Product Category legend is ordered by occurrence of a category from left to right. White spaces indicate that the spectral match was not identified in a particular product. Markings (line or circle) of product categories have been added only to aid in distinguishing product types.
