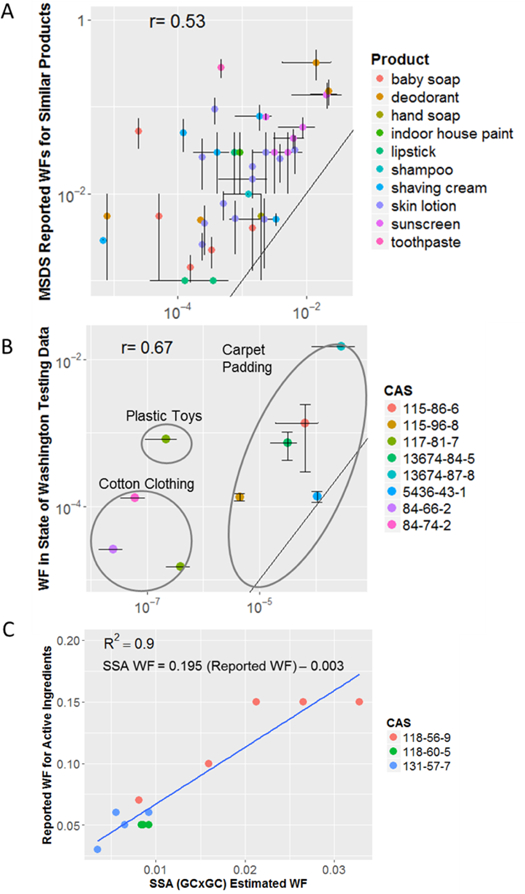
Figure 5.

Comparison of SSA estimated product weight fractions (WF) to other sources of weight fraction information. Black lines give the “perfect predictor” identity line. A) Mean estimated WF in products (bars indicate SD across samples) versus mean midrange WF reported on MSDSs for similar products (bars indicate means of reported bounds), and B) Mean estimated WF in products (bars indicate SD across samples) versus mean values reported for similar products in the State of Washington Product Testing Database. C) Estimated WF versus label-reported values for active ingredients in sunscreens (blue line is fitted model; note that the linear regression equation has been algebraically rearrange to be consistent with the regression coefficient provided in the Results and Discussion).
