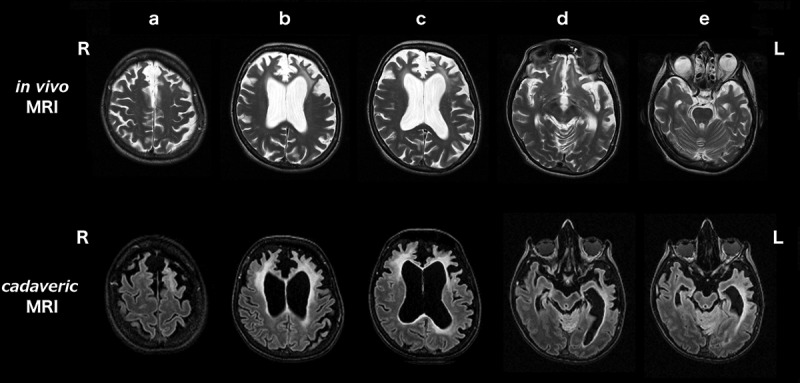
Figure 3.

Axial sections of the in vivo T2-weighted (top row) and cadaveric FLAIR (second row) MRI brain scans. Scans show the change in severity and distribution of WMH in the 2.6 year interval between scans, in the rostro-caudal direction from (a) to (e). (a) posterior frontal lobes, (b) anterior frontal lobes, (c) frontal poles, (d) occipital lobes and (e) temporal lobes. R right and L left side of patient.
