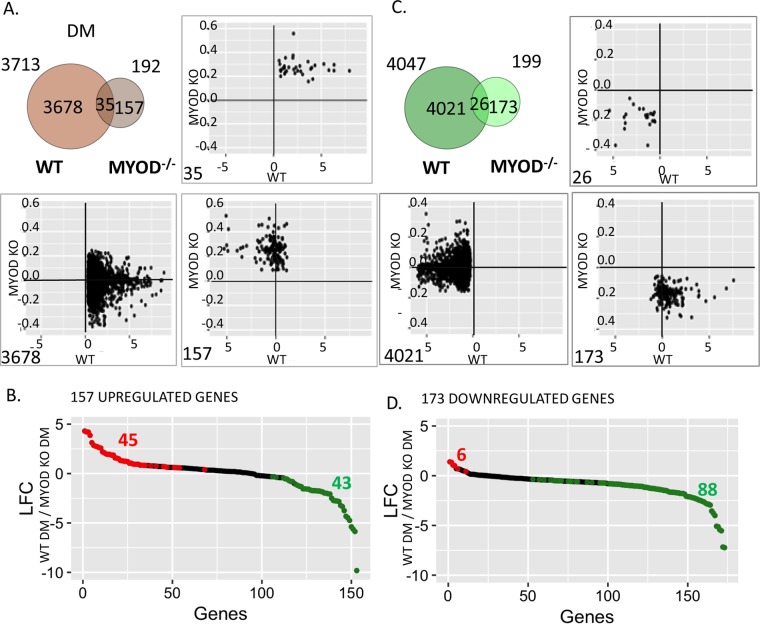
FIG 7.
MUNC overexpression regulates many cellular genes in the complete absence of MyoD protein. (A) Venn diagram representing overlap of genes that are upregulated upon MUNC overexpression in WT or MYOD−/− cells at DM3. The scatter plots show how MUNC overexpression regulates (log2 fold change in cells overexpressing MUNC relative to control cells transfected with the empty vector) the three classes of genes in WT cells and MYOD−/− cells. (B) The 157 genes upregulated by MUNC only in MYOD−/− cells were examined to see if they were induced or repressed by MyoD. The plots represent log2 fold changes of genes on DM3 in WT versus MYOD−/− cells. The red and green dots represent genes that were induced or repressed in WT cells (induced or repressed by the presence of MyoD protein); P < 0.05. (C) Same as panel A, except for genes downregulated upon MUNC overexpression in WT or MYOD−/− cells. (D) Same as panel B, except for 173 genes from panel C that were downregulated by MUNC only in MYOD−/− cells.

