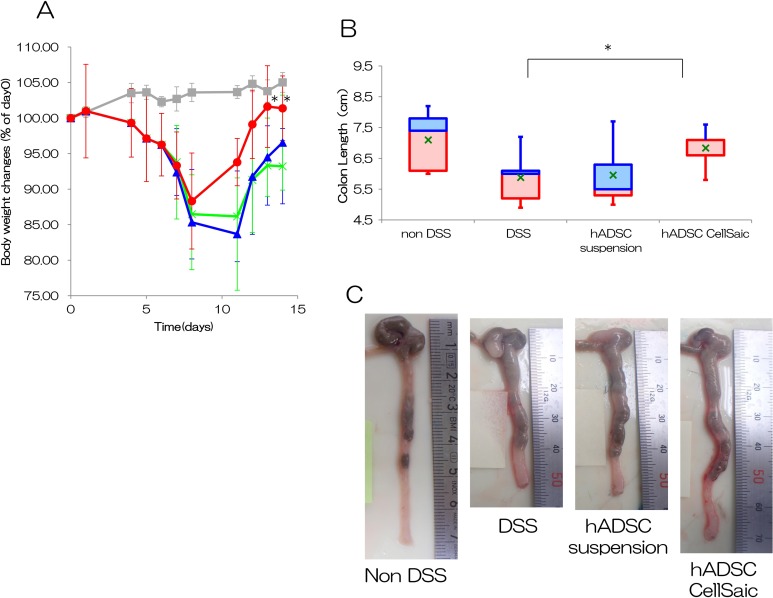
Fig. 2.
hADSC CellSaic attenuates recovery of body weight and colon length. (A) Percentage of body weight changes. Non-DSS group [no treatment with DSS, n = 5 (gray square)], DSS group [no cell transplantation into DSS mice, n = 5 (green cross)], hADSC suspension i.p. group [1.2 × 10⁶ hADSCs in suspension intraperitoneally administered to DSS mice, n = 5 (blue triangle)], hADSC CellSaic i.p. group [CellSaics of 1.2 × 10⁶ hADSCs and 1 mg u-pieces, intraperitoneally administered to DSS mice, n = 5 (red circle)]. *p < 0.05. The hADSC CellSaic i.p. group and hADSC suspension i.p. group were each compared with the DSS group by one-way analysis of variance with Dunnett’s test. (B) Colon length on day 14. The value of 75% – median (blue box), median – the value of 25% (red box), value of average (green cross). Non-DSS group [no treatment with DSS, n = 5], DSS group [no cell transplantation into DSS mice, n = 5], hADSC suspension i.p. group [1.2 × 10⁶ hADSCs in suspension intraperitoneally administered to DSS mice, n = 5], hADSC CellSaic i.p. group [CellSaics of 1.2 × 10⁶ hADSCs and 1 mg u-pieces, intraperitoneally administered to DSS mice, n = 5]. *p < 0.05. hADSC CellSaic group and hADSC suspension group compared with the DSS group. (C) The images of colon tissues. Representative images of colon tissue in each group were shown.

