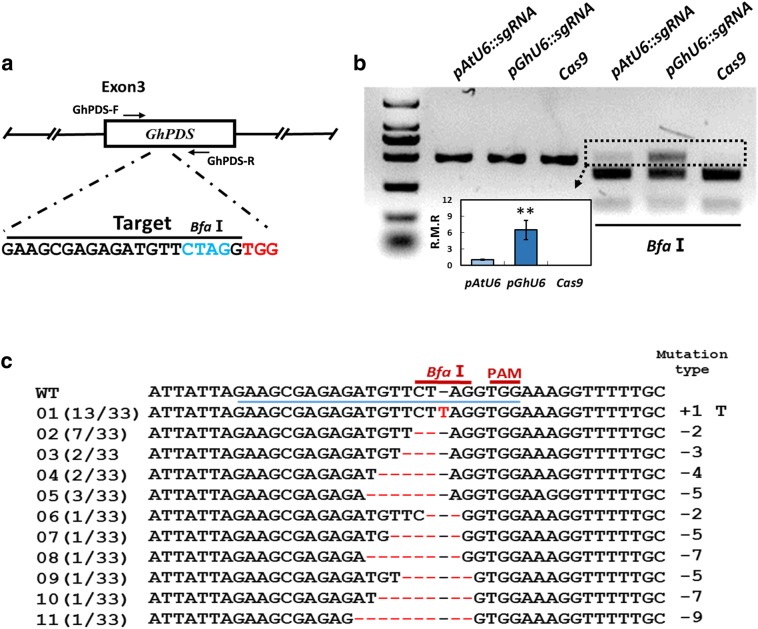
Fig. 3.
CRISPR/Cas9-induced targeted mutagenesis of GhPDS in cotton. a Position of the sgRNA-GhPDS target site in the GhPDS gene. GhPDS-F and GhPDS-R indicate primers used to amplify the target fragment. b Detection of CRISPR/Cas9 induced sgRNA-GhPDS mutations. Gel electrophoresis analysis of PCR amplicons of target fragments from Agrobacterium transient expression experiments using different CRISPR/Cas9 cassettes. 1–3: undigested PCR products; 4–6: PCR products digested with BfaI. The insert (column-value histogram) shows the relative mutation rates (n > 8, **P < 0.01, t-test). c Sequencing of mutated PCR products. The sgRNA target sequence is underlined in blue. Deletions are shown as red dashes, and insertions are denoted with red letters. The frequency of each mutation is shown on the left and the mutation types on the right

