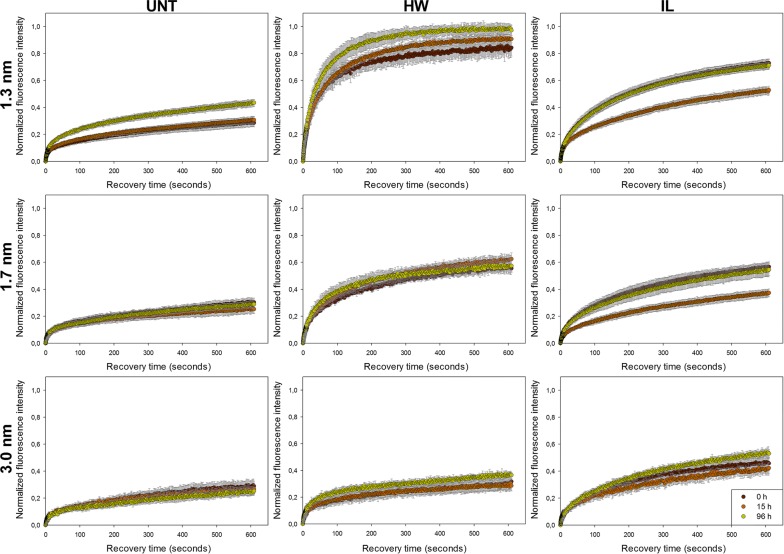
Fig. 4.
Fluorescence recovery curves of the different PEG-rhodamine probes measured on the untreated and pretreated samples enzymatically hydrolysed for 0 h (brown), 15 h (orange) and 96 h (green). Error bars represent the standard deviation between 8 recovery replicates. UNT untreated, HW hot water, IL ionic liquid

