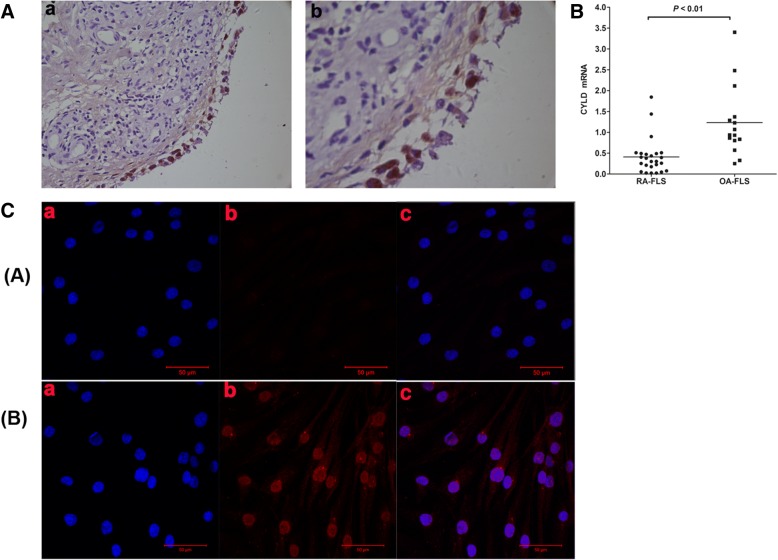
Fig. 2.
IHC and IF staining showing CYLD expression in primary cultures of FLSs from OA and RA patients. (A) Representative IHC findings of synovial CYLD expression. a, × 100; b, × 400. (B) CYLD mRNA expression in FLSs from RA patients (n = 25) compared with those from OA patients (n = 15), evaluated by RT-PCR. (C) IF staining of CYLD in primary cultures of FLSs from OA and RA patients. ([A] RA-FLSs, [B] OA-FLSs; a, DAPI [blue]; b, CYLD [red]; c, merged a and b. a, b: original magnification × 400.) Data are represented as mean ± SD

