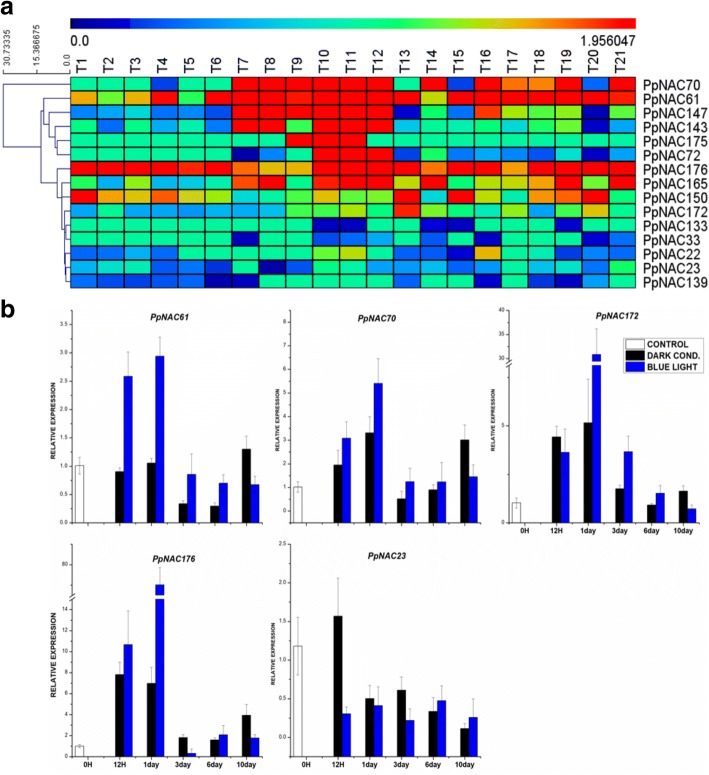
Fig. 6.
Heat map presentation and expression analysis of selected PpNAC TFs during fruit color development in different pear cultivars. a, Heat map of PpNAC TFs during fruit color development under sun light and dark light treatments i.e. T1-T3, T4-T6, T7-T9 and T10-T12 indicates 0 h, 6 h, 1 day and 6 days under sun light conditions while T13-T15, T16-T18 and T19 to T21 represents 6 h, 1 day and 6 days treatments under dark conditions respectively with three independent biological replicates of Pyrus pyrifolia ‘Meirensu’. The color key at the top of heat map represents log2 of RPKM values. b, Expression analysis of the identified PpNAC genes during fruit color development in P. pyrifolia ‘Red Zaosu’. Expression representation of some genes from subgroup 2A (PpNAC61, PpNAC70) and 4E (PpNAC172, PpNAC176, PpNAC23) under blue light and dark treatments with 0 h, 12 h, 1 day, 3 days, 6 days and 10 days interval. The data were normalized to the pear ACTIN expression level and the mean expression value was premeditated from 4 independent replicates while the standard deviation are also shown by vertical bars

