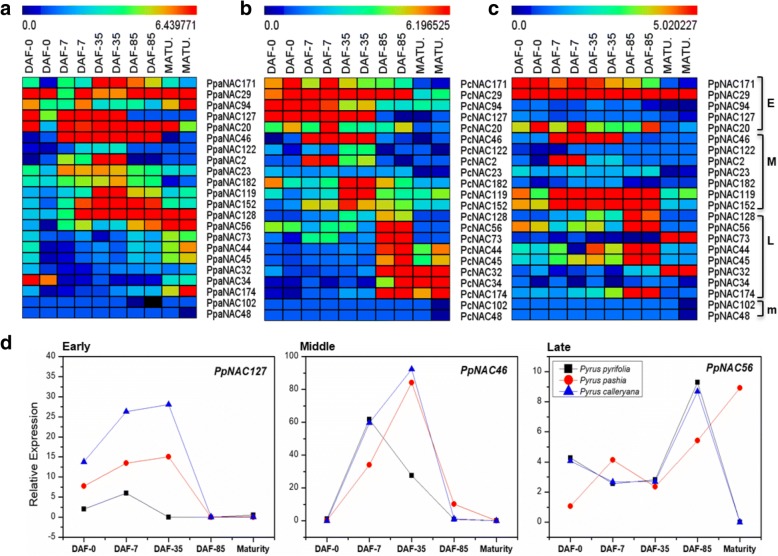
Fig. 7.
Heat map and graphical presentations of selected PpNAC TFs during fruit development in three different pear cultivars. a, b, c Expression profiles of PpNAC TFs from 0, 7, 35 and 85 days after flowering to fruit maturity with two replicates in P. pashia, P. calleryana, and P. pyrifolia respectively. E, M, L and m indicates early, middle, late and maturity related PpNAC genes respectively. The color key at the top of heat map represents log2 of RPKM values. d, Graphical representations of PpNAC genes related to early, middle and late fruit maturity based on RNA-seq values in all three cultivars

