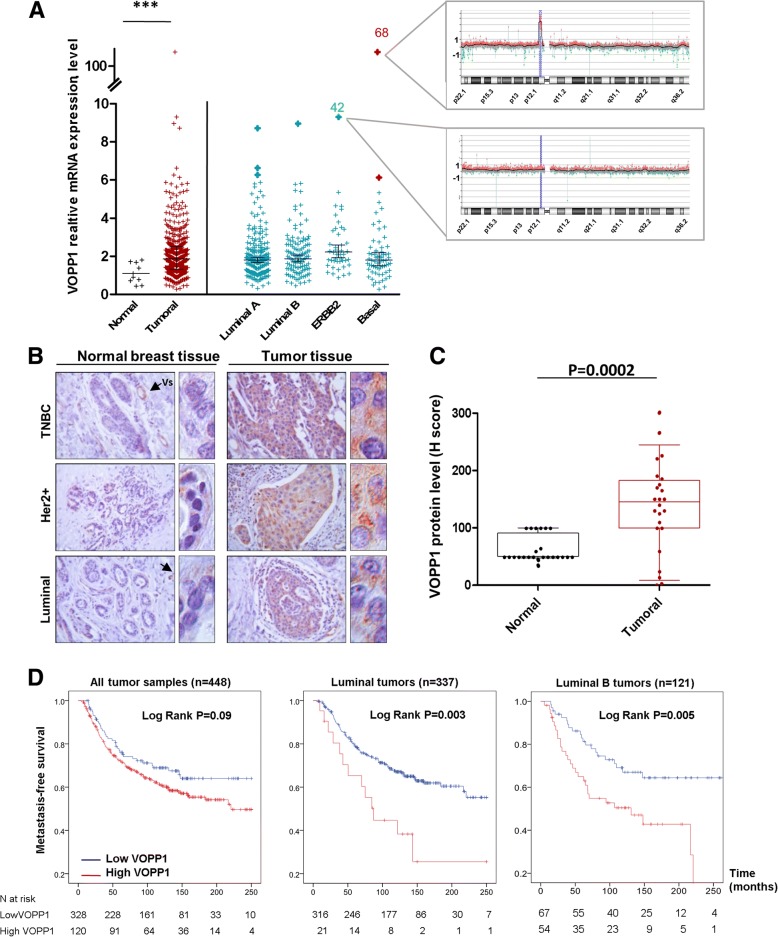
Fig. 6.
VOPP1 expression in human breast tumors. a Real-time PCR analysis of VOPP1 expression in 448 breast tumors. The CGH profiles showing the VOPP1 chromosomal region are highlighted for two tumors. Statistical analysis was performed using the Mann-Whitney U test (***p < 0.001). b Representative images of an immunohistochemical analysis of VOPP1 protein expression in a series of 24 tumors. Arrows indicate the blood vessels. c Quantification of the immunohistochemical results showed in b. d Kaplan-Meier curves showing metastasis-free survival rates of patients with tumors expressing high (red line) vs. low (blue line) levels of VOPP1 mRNA

