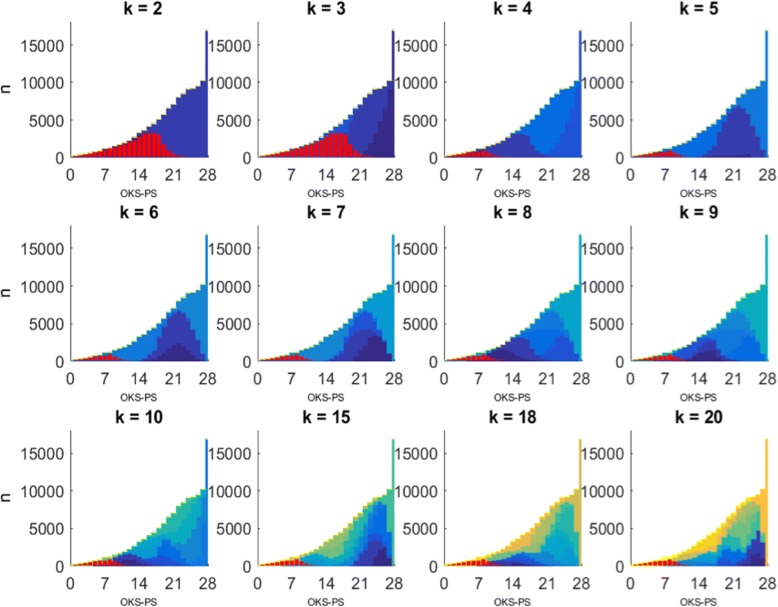
Fig. 1.
Distribution of clusters over OKS-PS score. Corresponds to primary analysis. k denotes the number of clusters derived. Y-axis represents the number of patients (n). Each cluster is shown in a different colour. The left-most cluster on the OKS-PS scale, i.e. the high pain-cluster, is highlighted in red

